Shorting Down Gaps
The ideal short meets two criteria.
First, selling pressure overwhelms demand, sending share price south. Second,
rather than restoring equilibrium between supply and demand, the initial
sell-off breaks the will of remaining shareholders, paving the way for further
selling and deeper price deterioration.
Gap-down price moves can flag this
opportunity. Under the right conditions, stocks that gap down in price have a
tradable probability of heading substantially lower.
Chart patterns and setups generally fall into one of two major camps: reversal or continuation. The setup that I’m going to show you in this lesson is a continuation technique. Candidates for the setup are stocks already in major declines before gapping down on negative fundamental news. You short after the gap-down once you detect evidence that the gap-down move, rather than exhausting the decline, is turning still more shareholders into sellers.
Profile Of the
Gap-Down Short
Of course, you don’t simply short
every stock that gaps down. To meet the profile of what I call the “gap-down short,” the stock
must meet criteria for price range expansion, volume expansion, downtrend,
overhead supply and response to fundamental negative news.
Here are my rules for short
candidates:
1. The gap-down move should represent
a severe price decline relative to the stock’s daily trading behavior. I don’t
use mathematical formulas. A eyeball judgment will do. The price breakdown
should be clearly extreme when viewed on, say, a six-month or three-month daily
chart.
2. Trends tend to persist. The stock
should already be in a downtrend just before the gap-down session or struggling
in trading range after coming well off its lows.
3. The stock should close below its
50- and 200-day simple moving averages. It can cross below either or both before
the gap-down day or on the gap-down day. I want the stock to be under massive
overhead supply. Overhead supply represents the amount of shares in
the hands of shareholders with paper losses. These weak
holders are under a great deal of stress. They tend to sell into rallies in
order to cut short their losses. And they tend to sell if the stock falls
further and finds their uncle point.
4. The gap-down move should occur in
response to negative fundamental news. Ideally, the company will already be in
trouble. Then before the open the company comes out in reports disappointing
earnings or issues an earnings warning, precipitating the sell-off.
5. The same goes for volume. On the
day of the gap-down move, trading activity should swell to at minimum double
that of the stock’s average daily volume. I use volume averaged over the past 50
sessions. I want to see a massive desertion of institutional cash.
6. The stock should close in the lower
half of the day’s trading range. The nearer the stock closes to the bottom of
day’s trading range the better. This raises the odds that institutions have
truly thrown in the towel. I don’t want bargain-hunters rushing in and buying
the stock with both hands.
7. The gap-down move should break through past support.
8. The market as measured on the major index of the candidate stock (e.g., the Nasdaq Composite for Nasdaq stocks) should should be in a downtrend.
Timing The Short
During confessional season leading
into the third-quarter reporting period in 2000, we saw a spate of gap-down
price moves following earnings warnings. In the wake of such a decline, there’s
an immediate threat of a bounce from bargain-hunting or short-covering. The
short seller should wait for the bounce to occur and exhaust itself, then short
after the stock resumes its decline.
The downtrend can resume in the very
next session. If it does, the pivot point is 1/8 point below the intraday low of
the gap-down session.
Of course, always set a price stop where you will cover your
short in case the stock rallies against you. Many intermediate-term momentum traders like to use fixed price stops (e.g., William O’Neil’s effectivie and popular 7-8% stop). However, because of the possibility of short-covering rallies, you must be prepared to give short sales much more room.
This means a volatility-adjusted stop. The more you allow a stock to move against you before closing your trade, the smaller your position relative to the total value of your account. For example, let’s say your account equity totals $500,000 and your maximum risk per position is 2% of total account equity. Your maximum monetary loss per position would be $10,000. So imagine that you plan to short shares in XYZ Company. Your go short at 20. Under your 20% stop, you would let the stock rally against your position up to 24 before covering.
That would represent a theoretical loss of 20% of your original capital if you were stopped out. Divide your maximum account loss per position ($10,000 in this case) by your maximum loss per trade (20% or 0.20), and you get your allocation (position size) for that trade ($50,000). The greater the risk, the smaller the position. The smaller the risk, the greater the position.
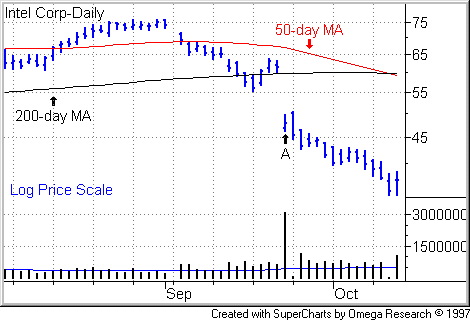
In a perfect world, I would set my stop a tick above the intraday low of the session before the gap-down day or a defined support level that was broken by the gap-down move (e.g., 55 in the following Intel chart). However, in the real world, the gap-down move itself may be so huge, that giving a stock this much room would require taking a ridiculously small position.
In such cases, I have a rule of thumb. I ask myself, what is the smallest position allocation needed to make the trade worth my while? Then I eyeball the chart and look at how far down I can bring the stop and still afford myself a credible volatility envelope. Now the question is, (1) at that stop price and (2) at my scaled down position size, is the risk to my total account equity within bounds? If the answer is yes, I’ll enter the trade if I get an entry signal. If the answer is no, I’ll fish elsehwere.
Now let’s look at some examples of the gap-down short.
After the Sept. 21 close, Intel
(
INTC |
Quote |
Chart |
News |
PowerRating)
warned that 3Q revenue would come in no more than 5% higher than the 1999 third
quarter, well below expectations. The guidance fueled fears of a slowdown in PC
sales.

Shares in the chip giant gapped down
at the Sept. 22 open and closed down 22% (see Point A
in above chart). The stock closed in the bottom half of the day’s trading range
and well below its 50- and 200-day moving price averages. Volume exploded to 309
million shares, seven times Intel’s average daily trade. The day’s intraday
price low was 46 1/2.
On Sept. 23, Intel opened up on light
volume, then headed south, breaking below the prior session low of 46 1/2 and
trigger a short signal.
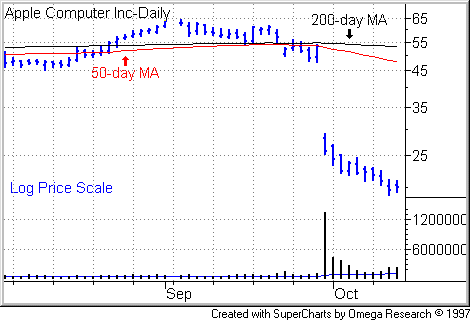
For another example, after the Sept.
28 close, Apple Computer
(
AAPL |
Quote |
Chart |
News |
PowerRating) warned slowing Power Mac sales would cause
4Q profits to come in much lower than expected.

As I pointed out in my Sept. 29, 2000 Trading
The News commentary, Apple underwent a classic gap-down sell-off the next
session. The stock closed down 52%, closing near the session bottom and setting
an intraday low at 25 3/8.
The day after the sell-off, Apple
bounced, then caved, triggering a short signal as it fell below 25 3/8.
Not all gap-down shorts bounce and
collapse the very next day. The stock may trade higher and still remain a short
candidate, provided the gains are meager relative to gap-down loss and come on
declining volume relative to the volume of the gap-down session. The short
signal comes if the stock falls below the prior session.
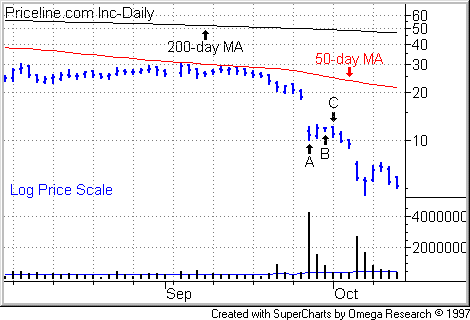
After warning of lower than expected
Q3 revenue, Priceline
(
PCLN |
Quote |
Chart |
News |
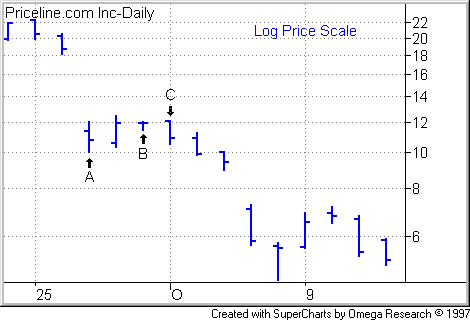
PowerRating) gapped down on Sept. 27 (Point A),
closing at 10 3/4. Shares closed up to 11 7/8 on Sept. 28, then traded sideways
to close again at 11 7/8 on Sept. 29, setting an intraday low 11 1/2. A move
below that low (Point B) would become your
pivot point to short. Priceline complied the next session (Point
C).

Here’s a closer view.

Â
For The Best Trading
Books, Video Courses and Software To Improve Your Trading
