Sidestepping Excess Volatility
The price action of a stock forming a
sound base tightens near the entry point. Patterns that are more failure prone,
or more prone to stopping you out, are fitful, making it hard to ride out normal
volatility without exposing yourself to large losses.Â
For an extreme contrast between these
two scenarios let’s compare OSI Pharmaceuticals
(
OSI |
Quote |
Chart |
News |
PowerRating) and Pfizer
(
PFE |
Quote |
Chart |
News |
PowerRating),
both of which appear to be basing.
Pfizer
(
PFE |
Quote |
Chart |
News |
PowerRating) gained 1 7/8 to 44
3/8, aided by a report that it was in advanced talks to co-market a promising
lung disease treatment being developed by German drugmaker Boehringer Ingelheim,
Reuters reported. The world’s largest drug maker declined to comment on a
Financial Times report that it and Boehringer were considering a revenue-sharing
agreement involving Spiriva, a smoker’s cough treatment.
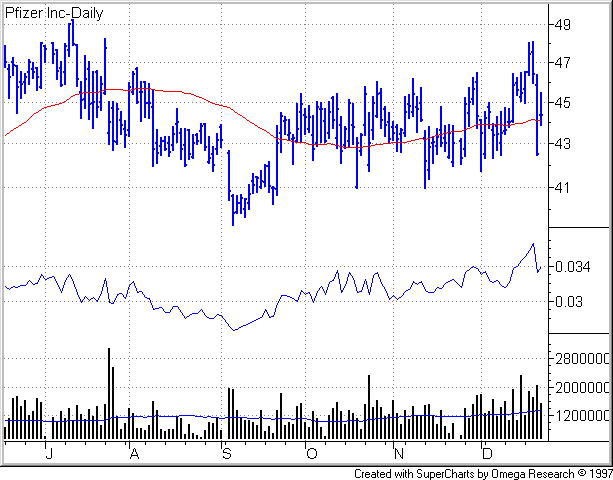
Notice the noisy, jerky character of
the stock’s price action since peaking at 49 1/4 on July 12. The base is not
overly deep, only 20% from July 12 peak to Sept. 6 trough. But since the trough,
the stock has continued to trade jaggedly across its 50-day moving average. If
the stock manages to close in on the July 12 high, I would need to see the daily
trading range tighten considerably before chancing a trade on a breakout.
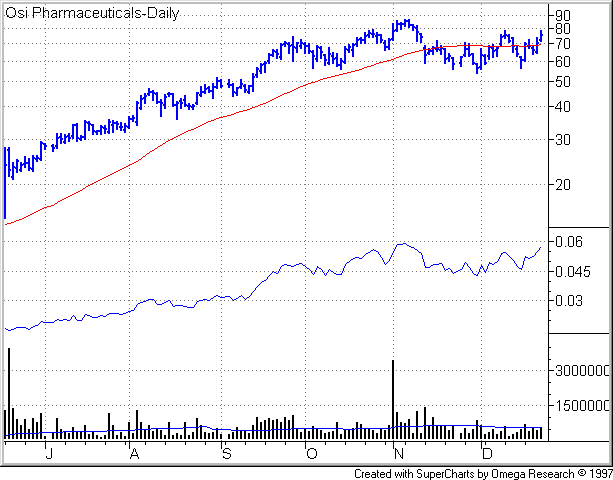
OSI Pharmaceuticals
(
OSIP |
Quote |
Chart |
News |
PowerRating) displays
a much more well-behaved price action. The stock moved ahead 4 15/16 to 75 5/16.
We’ll look at two charts of the stock. The first follows OSI over the same
timeframe as the previous Pfizer chart. OSI’s base is deeper than Pfizer’s, 37%
from peak from Nov. 6 peak to Nov. 30 trough, but by no means excessive. Notice
also the clearer uptrend OSI’s relative strength line.Â
Let’s take a closer look. In the
following chart, I’ve underlined declines and advances within the base, as well
as an intermediate peak (see Point A). As
the declines and advances show, OSI has its own volatility, but price moves in
one direction appear more likely to persist in the same direction for a time. In
my experience, that increases the odds that a trader can hold on once entering
the stock vs. Pfizer at present. Ideally, OSI would put in a tight little handle
here, then take out the intermediate peak on strong volume.Â
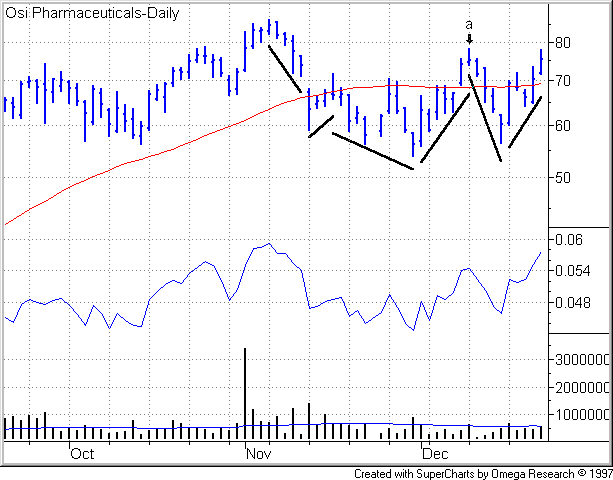
A typical entry would be as the stock
crosses 1/8 above the intermediate peak. If OSI moved straight through the
intermediate peak without strong volume, a trader could sit back and see if the
stock forms a handle above the peak, in which case the high of the handle would
be the pivot point.
The top field of all charts in this
commentary uses a logarithmic price scale and displays a 50-day price average in
red. In the second field, a
blue relative strength line represents the displayed security’s price
performance relative to the S&P 500. The third field displays vertical daily
volume bars in black with a 50-day moving average in blue for volume.
All stocks, of course, are risky. In
any new trade, reduce your risk by limiting your position size and setting a
protective price stop where you will sell your new buy or cover your short in
case the market turns against you. For an introduction to combining price stops
with position sizing, see my lesson,
Risky Business. For further treatment of these and related topics,
you’ll find extensive lessons in the Money
Management area of TradingMarkets’ Stocks Education section.