Strong Accumulation — So Now What?
Strong accumulation before and after
news is an obvious bullish sign in a stock. As an intermediate-term trader,
though, I’m not interested in short-term echoes as me-too trades jump aboard.
When I spot one of these advancers, my next move is to find a pivot point far
enough out to test the resilience of the rally that first caught my eye.
Take Carnival Corp.
(
CCL |
Quote |
Chart |
News |
PowerRating). Before
Thursday’s open, the No. 1 cruise line reported Aug. 31 third-quarter net income
dropped 4.5% to $396 million. But the Miami-based company said bookings were
showing sustained improvement, heralding strong profitability for 2001.
Quarterly earnings, helped by stock buybacks, were 67 cents a share, topping
estimates by 3 cents, according to First Call/Thomson Financial.

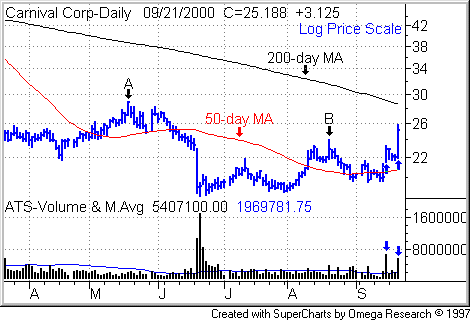
Carnival shares Thursday jumped 3 1/8
to 25 3/16 on triple normal daily volume as averaged over the past 50 sessions.
That powerful accumulation day confirms an earlier accumulation day on Sept. 15.
(Both accumulation days are marked with blue arrows
in the above chart.)
The stock also cleared resistance at
23 7/8 a share (see Point B in chart) and diminished
bullishly near the top of Thursday’s trading range. So where’s our next entry
point?
As an intermediate-term momentum
trader, I prefer to catch stocks much closer to their all-time or 52-week highs. At
minimum, I want a stock that has recently corrected to have overcome its mid
level as well as its 50- and 200-day moving averages. The mid level
represents the half way point between a stock’s pre-correction high and
correction low. Simply add the two prices together and divide by 2.
Carnival’s mid level sits at 37.34 — derived
from its April 12, 1999 high of 53 1/2 and its correction low of 21 3/16.
Traders looking for an earlier long
entry might use 28 7/8 as a pivot point where the stock ran into resistance on
May 18. (See Point A in chart.) At present,
the stock’s 200-day moving average is at 28 3/4 and heading lower. So a rally
above resistance at 28 7/8 should coincide with a cross above the 200-day if the
stock has not already overcome the 200-day by then.
The reasons for requiring stocks to
pass these tests has to do with overhead supply,
the amount of shares in the hands of shareholders with paper losses. These weak
holders tend sell into rallies. I typically want a stock to overcome
most of this overhead supply before looking for entry points.
All stocks, of course, are risky. In
any new trade, reduce your risk by limiting your position size and setting a
protective price stop where you will sell your new buy or cover your short in
case the market turns against you. For an introduction to combining price stops
with position sizing, see my lesson,
Risky Business. For further treatment of these and related topics,
you’ll find a mother lode of lessons in the Money
Management area of TradingMarkets’ Stocks Education section.
