Tech ETF Bounce
The tech-focused exchange-traded funds
Wednesday led on the upside, although the moves appeared to be bounces from near
over-sold positions.
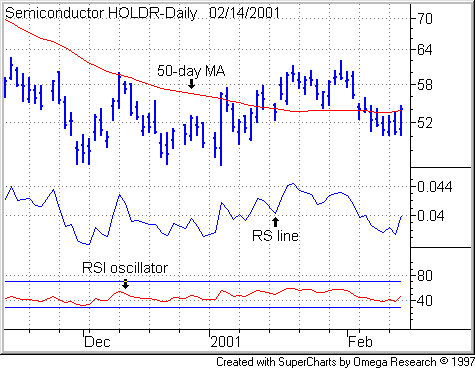
I’ve changed my chart format today to
include Welles Wilder’s Relative Strength Index (RSI) in the third. (bottom)
field. This is not to be confused with the Relative Strength line in the second
(middle) field. The RSI is an oscillator that measures a security’s performance
against itself. Although the indicator should not be used in isolation, very
high RSI readings suggest a security is over-bought and prime for a decline.
Very low RSI readings indicate an over-sold condition and susceptibility to a
bounce.
If a security is trending upward, and
an upward sloping relative strength lines is taken as bullish and confirmatory,
a downward sloping RS line is taken as bearish and divergent. If a security is
trending downward, the downward sloping RS line is confirmatory and bearish.
While RS and RSI can might seem
contradictory, they actually can explain movements over different time frames.
As you know, stocks don’t move straight up or straight down over long periods of
time. A stock in an uptrend will nonetheless encounter bouts of selling. A stock
in a downtrend will undergo pullbacks to the upside before resuming its downward
course.
For instance, I’m an intermediate-term
momentum trader. I try to hold stocks for moves of weeks to months,
assuming they don’t violate my stops. So, for example, I could be in a high RS
stock which is encountering a pullback. A check of its RSI might tell me that
the pullback is just a normal, short-term decline from a short-term overbought
position and the short-term players take profits.
For more on relative strength lines,
see my tutorial.
For an example of how RSI is used, check out my lesson, How
To Use RSI To Trade Index Funds. On this chart, the RSI overbought zone
starts at the 70 level, the oversold zone starts at 30, and a 14-day period is
used.
Okay, for those of you who already
know this stuff, thanks for your patience. For those of you who don’t, I hope
you found digression worth your time. Now on to the charts…
The Semiconductor HOLDR
(
SMH |
Quote |
Chart |
News |
PowerRating)
jumped 6.8%,
managing the session’s biggest gain among the exchange-traded
funds. While semis were due for a bounce, Applied Materials
(
AMAT |
Quote |
Chart |
News |
PowerRating)
provided the trigger. Overnight, the No. 1 maker of chip
gear reported fiscal Q1 earnings of 66 cents a share, excluding one-time items,
beating First Call/Thomson Financial’s consensus estimate of 62 cents.

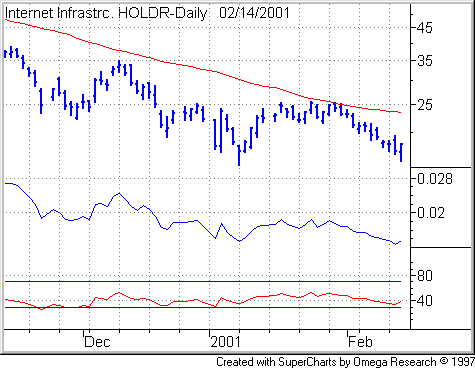
The Internet Infrastructure HOLDR
(
IIH |
Quote |
Chart |
News |
PowerRating)
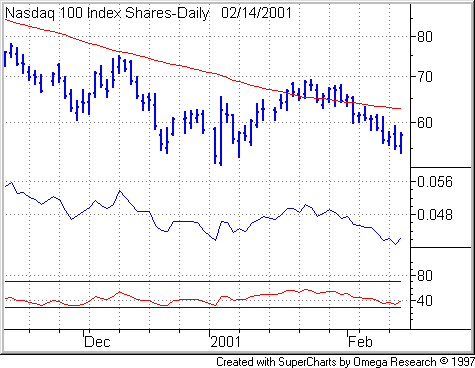
gained 5.6%, the Nasdaq 100 Tracking Stock
(
QQQ |
Quote |
Chart |
News |
PowerRating) 5.0%, the Dow Jones
Internet iShares
(
IYV |
Quote |
Chart |
News |
PowerRating) 5.0%, the Internet Architecture HOLDR
(
IAH |
Quote |
Chart |
News |
PowerRating) 4.2%,
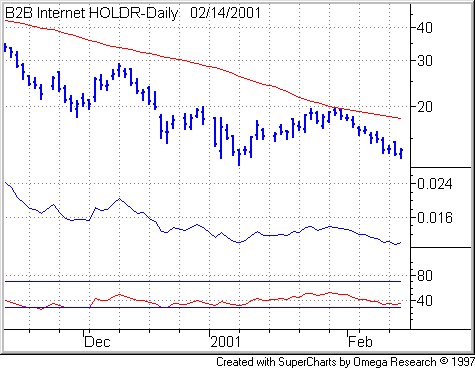
the B2B Internet HOLDR
(
BHH |
Quote |
Chart |
News |
PowerRating) 3.6%.
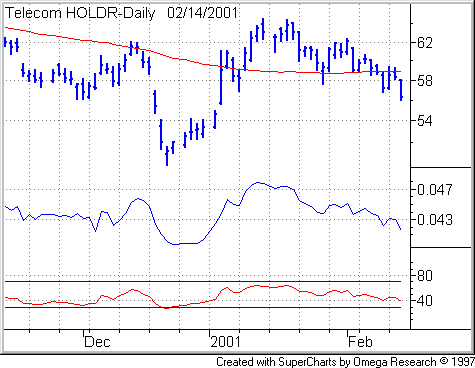
On the downside, the Telecom HOLDR
(
TTH |
Quote |
Chart |
News |
PowerRating)
lost 3.4%, the Dow Jones Telecommunications iShares
(
IYZ |
Quote |
Chart |
News |
PowerRating) 3.3%.