The Best Ways To Use TM’s News And Analysis Page
In my
previous lesson, I outlined a way to help you quickly identify
the strongest and weakest sectors of the market. You will recall that stocks
usually move in groups. So, by trading stocks in the strongest and weakest
sectors of the market, you increase the probability of a successful trade. In
this lesson, I will go a step further and show you how you can utilize the tools
right here at TM to help find and analyze stocks for the next trading day.
Step 1. Go To The StockScanner
After you’ve identified the sectors
you want to trade in, head over to the StockScanner.
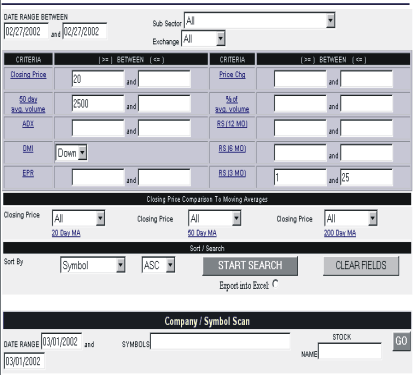
- In the upper right-hand corner in
the “Sub Sector” field, scroll down and locate the sub-sector(s)
that best corresponds with your sector of interest, e.g., the software
sector
(
$GSO.X |
Quote |
Chart |
News |
PowerRating) (if you identified it as one of the weakest sectors).
By eyeballing the chart, we see that the software sector is in a strong
downtrend as represented by the -DMI being greater than the +DMI — and that
it’s staging a countertrend rally. In this case, we select the
“Applications Software” sub-sector. Bear in mind that this is only
one sub-sector within the software sector and that you need to repeat this
process for all the other software sub-sectors. - In the “Closing Price”
field, enter “20” in the first box. The higher the price, the
better. It’s a lot easier for a higher-priced stock to move several points
than a lower priced issue. - In the “50-day average
volume” field, enter “2500.” This will give you stocks that
traded at least 250K shares for the last 50 days. This will ensure adequate
liquidity. - In the “DMI” field,
select “Down.” Since we are looking for short candidates, we want
stocks that are in a downtrend. If you are looking for long candidates,
simply change the DMI to “Up.” - In the “RS3” field, enter
“1” in the first box and “25” in the second. This will
give you the bottom 25% stocks. If you were looking for long candidates,
enter a “75” in the first box and leave the second one
blank. This will give the top 25% best-performing stocks.

Step 2. Go To The
“News & Charts” Page
-
Staying within the Stocks section,
click on “News
& Charts” in the upper right-hand corner of your screen. -
Click on “My Watch List.”
Your default Watchlist will contain three symbols: Dow Jones Industrial
Average
(
$INDU |
Quote |
Chart |
News |
PowerRating), S&P 500
(
$SPX |
Quote |
Chart |
News |
PowerRating), and Nasdaq Composite
(
$COMPX |
Quote |
Chart |
News |
PowerRating).
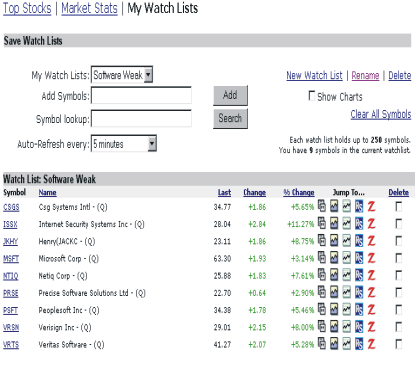
Here, you can begin to build your new Watchlists from the results of your
scans. Click on “New Watchlist.” A pop-up box will appear,
prompting you to enter a name. Simply give it a name and click
“OK.” For example, you can call this one “Software
Weak.” -
Input the symbols from the results
of your scan into your new Watchlist. Separate each symbol with a space.
Repeat if necessary, to create other Watchlists.
- Now it’s time to set up your
charts. Select “Snap Charts” or “Java Charts” on the
left side of your screen to begin analyzing each chart. Snap Charts are html
charts that need to be refreshed each time you make a change to the chart,
whereas Java Charts come up almost like a separate application. I prefer
Java Charts because they are faster, more user-friendly, easy to customize,
and you can draw trendlines. In addition, you can even e-mail someone a
particular chart of interest. Both charting features will automatically
store all of the stocks that are in your Watchlists. - Once in Java Charts, double click
on “My Charts” in the upper left hand corner. Inside you will find
all of the stocks that are in your Watchlists. Simply double-click on a
symbol to bring up a chart. - In the lower left hand corner,
click “detach” to put the chart in a separate window, whereby you
can adjust the size of the chart. -
Then it’s time to build your
technical analysis template. Under the “Tools” pulldown menu,
select “Customize Studies.” I’m a big Dave Landry fan, so Bow
Ties are a must. In order to create your customized
template, add the technical studies that you want and adjust the parameters
to your desires. Repeat if necessary to create other study templates.
Step
3. Analysis
Everyone like to focus on
trades that have a high probability of success. With that in mind, I like to
look for two particular kinds of setups:
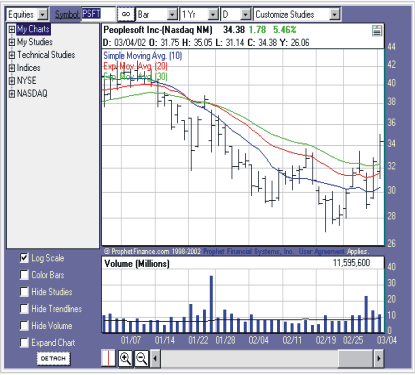
-
Pullbacks —
Pullbacks from highs and countertrend rallies from lows are the
bread-and-butter swing trade setups. There is nothing fancy about them, they
are logical, and they work. I mean, how else is a stock going to go higher
except by taking out its prior high? Vice versa for
shorts.

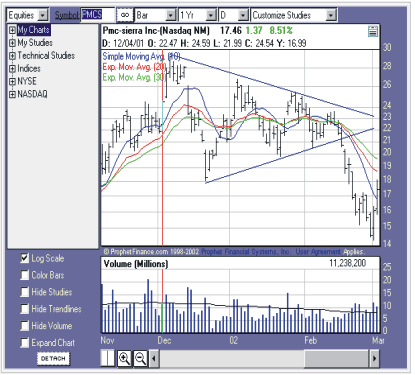
b. Triangles
— Triangles are another high-probability pattern. When prices go into
consolidation, eventually one side will win. They can be subjective at times,
but the results speak for themselves.

Step
4. Keeping Up With The Stats
During the market day, many key events are taking place. You can use the
“Market Hotspots” section to keep tabs on what’s happening. Here are
some things you should keep your eyes on:
-
Volume
— Markets need fuel to move, and volume is that fuel. Visit the “Market
Stats” page throughout the market day, especially the first half
of trading, to identify big moving days. -
52-week highs and
lows — Go to the “Top
Stocks” section and under the Category pulldown menu, look at who
is making new yearly highs and lows throughout the market day. In times of
weak markets, look at who is making new 52-week highs. These are that stocks
that are saying, “I don’t care about the market, I’m going
higher.” And in times of strong markets, look at who is making 52-week
new lows, as these are the dogs of the market and could be potential short
setups. -
Dollar Gainers and
Losers — These are the stocks that are the best and worst performers during
the day. The Dollar
Gainers and Losers lists give you a better representation of what’s
moving the markets. Many times, there is significant news behind the moves,
and you can read up on what’s happening by visiting the “News
& Charts” section.
Summary
This lesson just provides
an outline of how you can get more out of our site with tools such as the Stock
Scanner, News & Charts and Market Hotspots to help you find and analyze
stocks for the next trading day. Feel free to tailor it to your specific needs.
