The Levels For Thursday
Wednesday Recap:Â We had a good
day Wednesday with a profit of $355. Over the last 14 trading days since we
have started writing this column for Trading Markets, we have benefited from 12
profitable days and only two losing days.
In our prediction for Wednesday, we said the markets would continue on the
downside. Further, we e-mailed a sell signal to members before the opening of
cash trading, attempting to sell the mini-Sized Dow futures at the top of the
market (10534). In fact on Wednesday, the cash Dow started the day gap lower,
testing the 10510 region. The Dow then broke lower to the 10480 level where it
essentially traded for the balance of the day. During this period of time we
e-mailed members a buy signal. Then at 3 PM New York time something interesting
happened. The Dow spiked just above the 10520 level – and back into the trading
channel we had identified yesterday (see chart below). Unfortunately, once over
10520 the time price opportunities favored sellers and the markets moved back
down into their value distribution area to end the day exactly at 10480.  While
the markets were down, the advance decline line was only slightly negative with
1.4 billion traded.Â
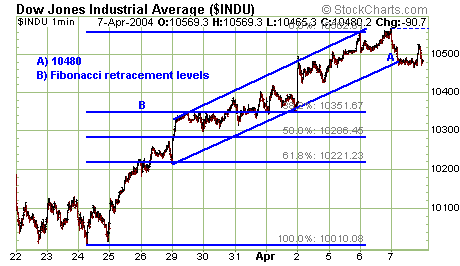
You’ll note that the chart above is the exact chart we posted yesterday
morning, only with the addition of Wednesday’s price action. As you can see we
indicated 10480 would be a significant point of support, and in fact the cash
Dow closed exactly at that level.  Also note that once the Dow hit the bottom of
the trading channel we previously identified it found support and essentially
traded sideways for the balance of the day.Â
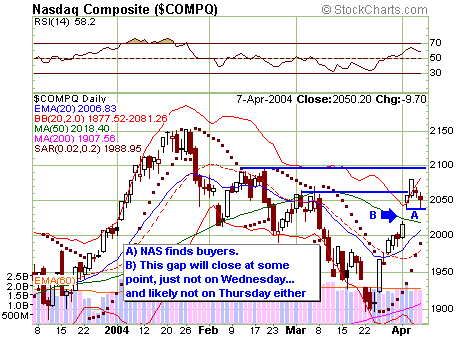
Interestingly, the NASDAQ was the best performing index of the day, down only
.5% while the Dow was down close to 1%.  That’s good for market bulls. On the
day the NAS moved very close to the upper gap envelope and found buyers at this
level. We have thoughts on this in today’s prediction.
Prediction for Thursday: Before the cash markets closed
Wednesday, we issued members a buy signal and said we thought the markets would
move higher on Thursday. There is a good chance this will happen. It is
interesting to note the the Dow has a tradition of closing higher the day
before Good Friday, closing higher the last five years.
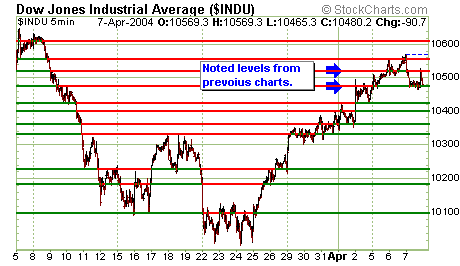
On the cash Dow I will watch the 10510-20 level, which I expect to be
broken. This could then become a support/consolidation region After this keep
an eye on the 10550 magnetic region. If buyers can power the Dow past this
level, sellers are likely to take control near 10580 and then again 10610.Â
Depending on the set-up tomorrow morning we might become sellers if the Dow
reaches these upper levels Thursday. While I expect the markets to move higher
Thursday, from a certain perspective they are starting to look sort of toppy.Â
Over the next few days if the markets can’t break past their recent highs, we
could see the Dow move to once again test the 50 day MA – and this time that
level might break, which would lead to a move to the 20 day EMA.Â
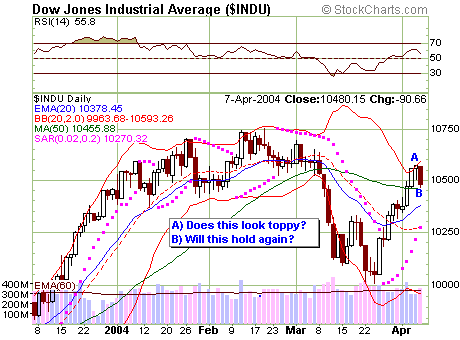
One interesting point to watch is going to be the intermarket relationships
between the indexes. I expect the NAS to continue to lead the market higher on
Thursday. On the NAS, let’s watch what happens at the 2060 level. If that is
broken we could challange resistance near 2100. If this happens, the entire
market is likely to move higher with it. Conversely, if the NAS can’t break
that level, we could move to test important support near 2040 (A on NAS chart
above). This upper gap envelope is important support. If it is broken, we
could move to fill that gap I’ve been watching (B).  As I have noted in past
predictions, when the NAS starts to fade relative to the Dow and S+P, that will
provide us a clue to future overall market weakness. On the downside, if the
NAS breaks and holds under support at 2040, I would then expect the S+P to test
strong support at the 50 day MA.
On the S+P, if we move higher I would expect any rally to run into some
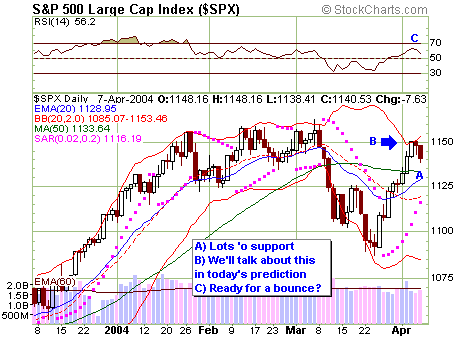
sellers just above 1150Â (level B marked at the S+P chart on the top of this
page).  This is an important point for the markets as a whole and will serve as
a confirmation point if the bulls muster some courage. If bulls bust past this
level, we could be headed for the yearly highs. However, if we can’t pierce
this level we could roll over to the dark side and test strong support at the
S+P’s 50 day MA. Â
Portfolio Strategy: Right now we are delta positive. We’ll
likely stay positive until the cash Dow gets near 10550, when we’ll get close to
neutral, and then near 10580 – 10610, when we’ll get negative. Members watch
your e-mail for specific trade recommendations in the mini Dow futures.   Â
Daily Profit: $355
9700 April Mini Dow Put Options: We are long 2 put options. Yesterday they
closed at 3, down 1 (each point is worth $5). Loss on the day with this position
was $10.
9900 May Mini Dow Put Options: On 4/2/03 we bought two mini Dow put options
for 69. Yesterday this option closed at 55, up 6. Loss on this position was
$60.
10000 April Mini Dow Put Options: We are short four put options. Yesterday
this option closed at 7, down 1. Profit yesterday with this position was $20.
10400 April Mini Dow Call Options: We are short two call options. Yesterday
this option closed at 135, down 30. Profit yesterday with this position was
$300.
10400 April Mini Dow Put Options: We are short two put options. Yesterday
this option closed at 50, up 10. Loss on the day with this position was $100.
10500 April Mini Dow Put Options: On 4/7/04 we bought one mini Dow put option
for 101. We are now short one put option. Yesterday this option closed at 85,
up 15 from the previous close. Profit yesterday with this position was $45.
Mini Dow Futures: On 4/7/04 we purchased one June mini Dow future at 10468.Â
The mini Dow closed at 10488. Profit yesterday with this position was $100. We
are now long one mini Dow future.
Projected Net Maintenance Margin Required (Minimum amount required to
trade this position, may vary broker to broker. Amount specified is
derived from our options analysis software):Â $13,625
Current Projected Delta: +72.19
Current Projected Gamma: -68.72
Trading Method:Â Mark Melin strategically short sells options and then
directionally trades within this short options portfolio, always hedging one
position against another to generate consistent profits.
Send comments and questions to Mark
Melin.
Â
