The Next Leg Down
Sideways price action
can dull our instincts to the point that we fail to
notice when conditions are about to change.
Mounting evidence suggests that the two-month trading range in the major
indices is close to breakdown. This event could correspond with a barrage of
June earnings warnings and set up a test of the bear market lows. Plan now by
watching the price action while the markets bounce after the violent selloff
earlier this week. They are sitting right near support and may offer profitable
clues just before the break.
So this is bad news for the bulls, right? No, probably not. You can’t build a
tall house without a nice, solid foundation. Those who believe in V-type market
bottoms also put their faith in the tooth fairy and the Loch Ness monster. The
rest of us understand that we won’t be returning to 1999 conditions anytime
soon. The best thing that could happen to our bruised markets is a long basing
period on lower volatility.
So how did we get back to the bottom of this range in the first place? Just
rewind a few days to the false breakout.
False breakouts actually benefit price prediction. They open a window into
true supply-demand and often precede strong price movement in the direction of
the failure. The reason for this is simple. Many traders and investors take
positions to support a breakout, but then get trapped when it doesn’t move
higher. This creates a generous supply of sellers when price falls back into its
former boundaries.
We witnessed this classic bull trap with a 1-2 punch in recent sessions.
First, Nasdaq and the SP-500 fell back into their price channels after a
well-publicized breakout. This initiated moderate selling pressure late last
week. Then the second shoe dropped. The downdraft forced the Dow-30 back through
its major breakout level over 11,000. This triggered a barrage of sell stops and
broken hearts.

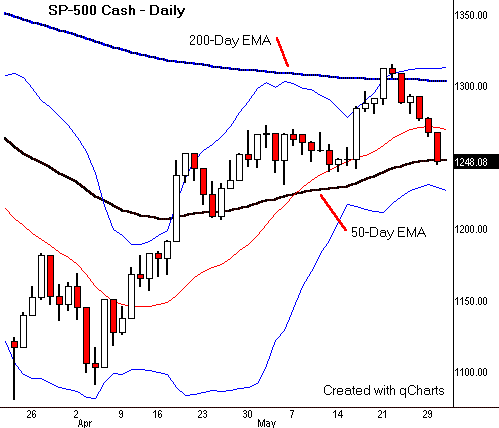
If a single moment signaled the end of the spring rally, it took place on
5/21 when the SP-500 struck its 200-day moving average. Rising price is often
drawn like a magnet to strong resistance, such as this major average. The
attraction can be so strong that it carries price past other common barriers,
such as well-defined price channels. Unfortunately, demand can dry up very
quickly once price reaches a magnetic target and ignite a fast roll over.
The SP-500 is now caught in a pleasant game of 50/200 pinball. Notice how the
boundaries of these two major averages define the rising price channel. After
the index hit the 200-day MA, price reversed and fell all the way back to the
50-day MA, where it now sits. This simple pattern often predicts an impending
breakdown through the lower average right after price finally reaches the
200-day MA in a series of steps. The three short-term highs since mid-April set up
these conditions perfectly, and argue for an immediate break to lower prices.

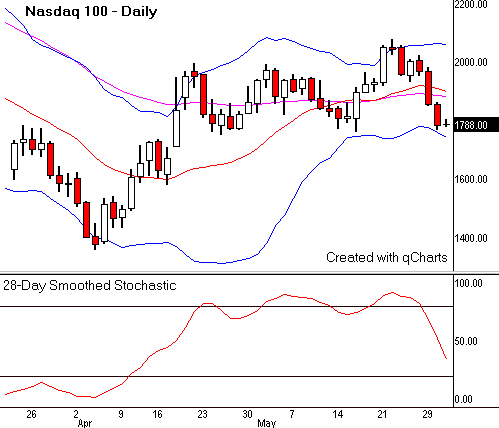
Strength oscillators set to longer-term readings are rolling over quickly in
all of the major indices. This suggests that broad market cycles are taking over
control of market direction. Similar readings are showing up in a variety of
major markets and trading vehicles. Many of these markets have just bounced off
of their 200-day moving averages as well. And many stocks in leading sectors
exhibited technical breakdowns during the selloff earlier this week.

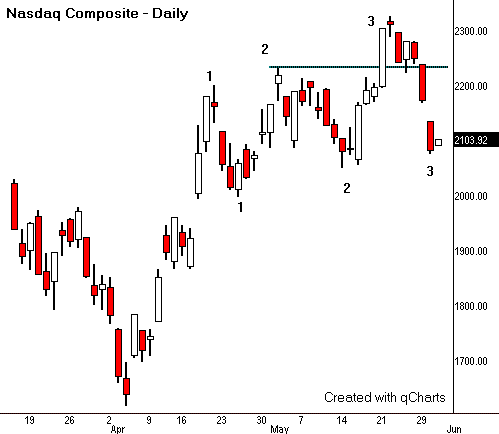
Pattern analysis supports this “end-game” scenario. Price channels
and other rectangular-type patterns often build three relative highs and lows before
breaking out or breaking down. This number set matches an Elliott Wave series
that completes a full trend or countertrend move. But rather than getting stuck
in an EWT debate, just focus on the suspected pattern after it completes three hits in
one direction, but only two in the opposite direction. If it then pulls back a
little and charges for the fourth time, expect a breakout in that direction. But if
it falls all the way back for a third hit at the other extreme, look for a
breakdown there right away, or after a weak bounce.
At least one pattern element supports a bounce here before lower prices.
Classic Dow Theory expects a lower high before a topping pattern completes. In
the examples shown above, the last price swing actually reached new highs. This
suggests there will be at least one final bounce before a breakdown. A natural
target for this rally would be the level of the high that preceded the final
high in the series. As the Composite chart shows, this might take the average
back above 2200. It might also print the right shoulder of a Head-and-Shoulders
pattern.
So what happens if this two-month trading range finally breaks down? Clearly,
all eyes will be focused on the bear market lows. But it’s unlikely that price
will fall that far back into the hole anytime soon. More likely, this breakdown
will set off a long period of lower volatility and broad sideways price action.
Fortunately, this is just what the markets need to complete their final bear
phase and get ready a sustainable bull leg.
Basing patterns tend to form with sharp movement out of a first low, and
gradual rolling movement through a second low. This second phase can be quite
boring. It tends to last many more bars than the exciting “V-type”
move that comes first. But markets need this quieter price action to complete
their bear washouts. Smart traders can still make a comfortable living in these
duller conditions. But it may be more fruitful to avoid the momentum game and
stick with classic swing-trading tactics until the bull reawakens.
