The Psychology Of Chart Patterns
More than once, finance profs have
told me that chart patterns don’t work. After all, why should the market obey
a chart pattern?
This misses the point about patterns.
Patterns don’t dictate to the markets. Human collective behavior dictates to the
markets. And as a species, human beings act today just we did thousands of years ago when we first came together to trade in markets. We chase the prospect of profits. When returns become overabundant,
the crowd turns greedy. When price turns against us, the herd becomes anxious,
anxiety gives way to fear, fear gives way to panic. Then in come the bargain
hunters, and the whole process starts again.
Variations on this theme have recurred
throughout history. Valid chart patterns are simply the graphic record of these
recurring turns in the crowd, expressed through price and volume.Â
The trading literature
does a pretty good job describing patterns and how to recognize them. I am going to go a step
further. I want you to grasp the forces at work behind patterns. In my own experience, I found this understanding improved my ability to interpret charts as well as my skill at pattern recognition. I will take you step by step through a chart pattern. As the pattern unfolds, I will explain the underlying shifts in the balance between
bullishness and bearishness, demand and supply.
For our behind-the-scenes technical
analysis, I’ve chosen the cup-with-handle pattern because it’s easily the best-known chart formation to the intermediate-term trader. The pattern is
also known as the saucer-and-platform. Gilead Sciences
(
GILD |
Quote |
Chart |
News |
PowerRating), a Foster
City, Calif.-based biopharmaceutical company, traced an example of one in 1999
prior to making an explosive advance.
The
following chart employs a logarithmic price scale and 50-day moving average
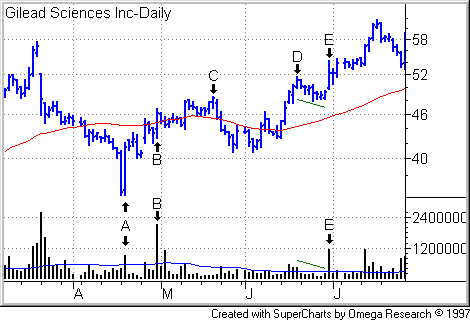
lines for price (in red) and daily volume (in blue). As you can see, Gilead
shares peaked at 57 1/2 on March 19, 1999. In the next session, March 22, the
stock gapped down and fell further on 2.6 million shares, five times its average
daily volume.Â

Fear Ascendant
This is a decisive break. Trust your
eyes. Let the stock talk to you. All the signs point to more downside ahead. A
sharp price decline (15% from close to close), a U-turn to the
south, a close in the bottom half of the daily range. Lending clear authority to
these signs are the dramatic expansions in both volume and daily price range.
What are
all these signs telling you? Fear is taking hold of shareholders. And no one is
coming their rescue. People are heading for the exits, and whoever remains in
the stock must be reaching for the Rolaids. That may sound obvious, but you’d be
surprised how many people try to trade against such powerful directional
movement. Â
Panic &
Capitulation
For a few days, the stock tries to
make a stand just above 45 7/8, the intraday low of the selloff session. Note
the progressive decline in volume. Fewer and fewer buyers are willing to step up
to the plate and take shares off the hands of anguished shareholders.
Sellers next resort to dropping their
ask price in an effort to entice more buyers to market, and the price
crumbles further. Meanwhile, those holding on in desperate hopes that the stock
will recover come under increasing strain.
Efficient market
theory holds that markets act quickly to adjust prices in response to new
information. Over the long run, that’s correct. But in the short run,
emotions, not rationality, can prevail. A large number of remaining
shareholders, shaken by the selloff, now are being subjected to water torture
as the price slowly deteriorates. Pain and fear build slowly until panic ensues.
At some point, the price will go into
freefall once enough shareholders facing mounting losses run for the exits. I
never try to predict the breaking point. That’s a function of the unknowable mix
of personalities within the shareholding crowd and their cost basis in Gilead
shares. I let the market tell me.Â
Shareholders capitulate on April
19, sending the price down 12%. The following session, on April 22, the smart
money comes in. Gilead shares reverse and close up 15% on volume of 880,000
shares. (See Point A in chart.) That amounts
to a 60% increase above normal volume as averaged over the past 50 sessions.
Only institutions marshal that kind of buying or selling clout.
Overcoming Weak
Holders
The April 22 session marks the
bullish complement to the March 22 selloff: a sharp price gain and close in the
upper half of the day’s range, with the added credibility that comes with
expanded daily range and volume. However, the stock remains unsuitable for the
intermediate-term momentum trader. The stock still must overcome the problem
of overhead supply
posed by weak holders.
Overhead supply is the amount of shares in
the hands of shareholders with paper losses. Wall Street calls these people weak
holders. In the wake of severe price decline, the weak holders want
out of the stock. They tend to use rallies as an opportunity to exit. You want the weak holders to exit a stock before you buy. Once you go
long, you want your fellow shareholders to hold tight. This reduces the
selling supply of stock coming to market at the current best ask price, forcing
would-be buyers to bid up the share price.
There are several tests that I use to
determine whether a stock has overcome overhead supply. A stock must
pass these tests before I even consider looking for entry points. First, I
insist that a stock has overcome its 50- and 200-day moving price averages.
Gilead began trading in December 1998, so it had not traded long enough to
establish a 200-day average in this example. So we’ll use just the 50-day average.
Second, I also require the stock to
exceed its mid-level, the halfway point between its pre-correction intraday high
and the subsequent intraday trough of the correction. To find the mid-level, you
sum the two prices and divide by 2. That yields a mid
level 46 11/16 for Gilead in this example.
It’s also important to see the stock
follow through to the upside on strong volume. First, strong volume lends authority to the direction of accompanying price move. Second, strong volume
means turnover. You want to see lots of shares change hands, a sign that bulls
are replacing more weak holders, changing the composition of the shareholder in
favor of the bulls.Â
On April
30, Gilead shares surged higher on 2.1 million shares, more than triple normal
volume (see Point B in
chart). Clear accumulation. The stock also cleared its 50-day moving average.
After a tug-of-war around the 50-day, the stock headed higher but soon encountered resistance
around its mid-level. This is normal. Then Gilead peaked at 48 3/8 on May 20 (Point
C) and pulled back.Â
This is normal and
potentially even healthy. You don’t want V-shaped correction-recovery patterns.
These are failure prone as sharp gains over brief time frames tempt
profit-taking by bottom feeders and loss-taking by weak holders. You want a
stock to advance on strong volume, then consolidate, even pull back on weak
volume, indicating more weak holders are getting out of your way.
Personality Change
Gilead obliged. The
May-June pullback came on average-to-sub-par volume. In another constructive sign, the stock held well above the low of the correction, then resumed its advance.
This amounts to a positive change in the stock’s trading behavior. The pullback
did not precipitate a new rush for the exits. Bulls appear to be gaining the
upper hand. Some of the weak holders may be taking heart.
Over the
remainder of June, the stock crossed back above its 50-day moving average, then
its mid-level. Now you can start looking formation of a handle. On June 18, the
stock put in a new peak at 51 1/2 (Point D).
That‘s your pivot point. If the stock forms a
proper handle from here, you buy if the share price crosses 1/8 point above the
pivot on strong volume.
Interpreting
Handles  Â
Why do you want
handles to form? Once you buy shares in a stock, you want your fellow
shareholders to hold tight. You want as little selling as possible because if
selling pressure (supply) exceeds buying pressure (demand), the share price will
drop. If demand outstrips supply, buyers must bid up the price in order to entice
sellers to market.Â
As a recently
corrected stock forges higher, two groups of shareholders feel an increasing
temptation to sell —
the weak holders and the bottom buyers. The question is, will they dump large amounts of stock? Or is the vast majority of shares outstanding now in the hands of bulls,
people who will hold on in hopes of further price appreciation? A sound handle suggests the latter condition is the case.
If the stock falls on
strong volume, the situation remains too dicey. But if the stock drifts lower on
light volume, and volatility contracts (as evidenced in tightening daily price ranges in
the handle), chances are, shareholders are holding tight while the last of those
pesky weak holders are dribbling out of the stock.
Gilead formed a handle
with the desired volatility and volume contractions. Notice the tightening daily price
ranges. Finally, look at the corresponding trading volume, which like the price
is wedging downward (both movements underlined or over-lined in green).
Notice also that
the handle did not pierce appreciably below the resistance at May 20. A bullish
sign is when past overhead resistance becomes a support level. The lows of the
handle also formed above the mid-level. Another good sign.
Breakout
As I said
before, powerful volume lends credibility to a price move. Powerful volume means
institutions are piling into the stock. These institutions cannot possibly hope
to take significantly sized positions without affecting price. If you act
quickly and buy as soon as the stock clears the pivot, you improve the chances
that you’re getting on the leading edge of an institutional buying wave. This
gets you in with your relative small position with ample buying power pressuring
the stock higher after your entry. Gilead broke through its pivot June 30 on
nearly four times normal volume (Point E).
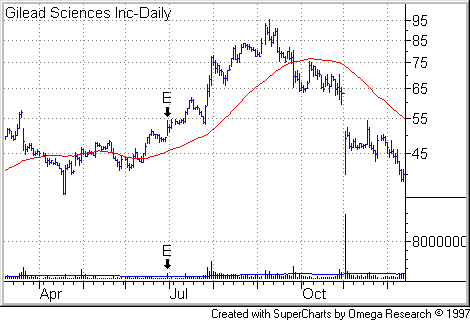
Here’s a larger view
showing the stock’s trading activity through Dec. 13, 1999. As in the prior
chart, Point E indicates the June 30 breakout.

For The Best Trading
Books, Video Courses and Software To Improve Your Trading
