Thursday’s Levels
Wednesday Recap: We had another
good day Wednesday with a profit of $310. Yesterday we predicted the markets
would move lower, but we also questioned if they would find support and bounce.Â
In fact the markets did move lower and bounced, but the question still remains:
did they find important support? Are they ready for a meaningful
bounce?
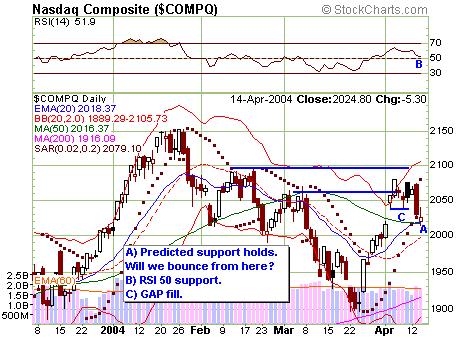
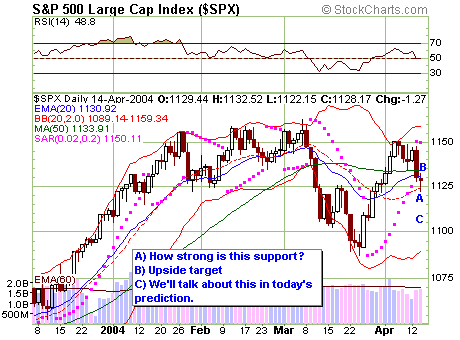
Our first level of predicted support on the NASDAQ yesterday was the 50-day
moving average and 20 day exponential moving average, which were converging
yesterday (A on chart above). We also said that the gap (C) would likely be
filled, and that occurred.Â
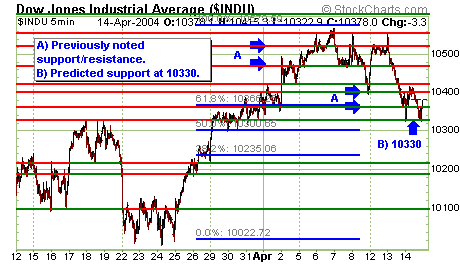
You will recall that in yesterday’s five minute cash Dow chart we highlighted
the 10330 level. In fact on Wednesday the cash Dow started lower, successfully
testing the 10330 level early in the trading day. From there it bounced just
above 10360, which served as support for the Dow to take on the 10400 level.Â
The Dow briefly moved its head above the 10400 level, only to get slapped down
before it could even touch my next resistance line. Unable to move higher,
sellers got courage and the markets moved lower.  On the Dow the 10400 level
couldn’t hold and the market’s measure moved down hard and fast to once again
test 10330. From here it bounced in between 10330 and 10360, before jumping
higher at the very end of the day to close at 10378, down only 3 points on the
day.Â
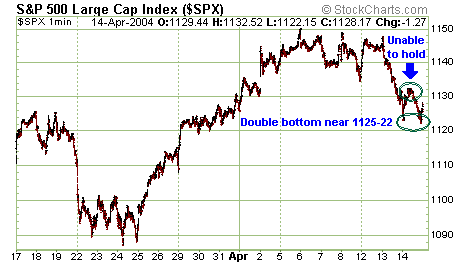
In many respects the Dow charts look similiar to the cash S+P. The S+P
started the day by testing predicted support near 1125, then bounced just above
resistance at 1130. Unable to hold it moved back to test support. On the day
the cash S+P closed down only 1.27. However, while most of the major indices
showed little change, the advance / decline line was negative big time, with
decliners sticking it to advancers by about a 3 1/2 to 1 ratio on the NYSE. On
the big board, down volume swamped up volume by 2 to 1.
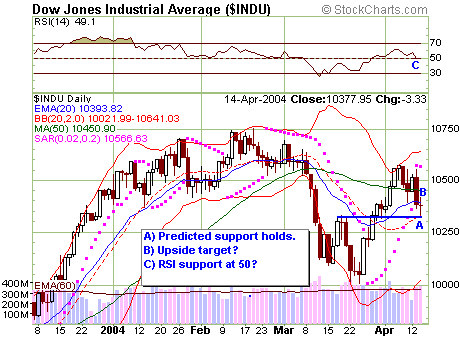
Prediction for Thursday: We’re at a point of inflection, a
fork in the road. You can see the indecision in yesterday’s candlestick. At
this point we could move in either direction, and that would then define our
near term targets.
 Â
Â
On the S+P, a move and hold below the 1125-22 level would indicate a move
lower. And on the Downside, there is some room to move. In fact if we move to
the downside would could move to the C point in the chart above. However, on
the upside if we break and hold 1130, our next target would be the 50 day moving
average, B on the chart above.
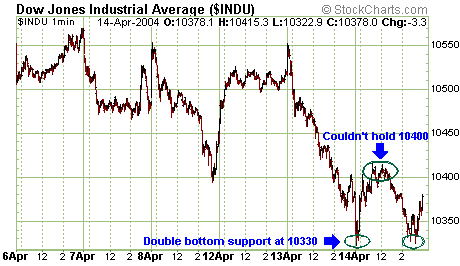
Again on the Dow, I expect 10330 to serve as important support. A break of
this level and we could run to 10300 and below. On the upside, a break and hold
of 10400 would indicate a move to test the 50-day moving average. Now, if we
break 10400 and don’t hold again I expect that we will then have significant
downside momentum to push the market to test — and potentially break —
downside support.Â
Let’s watch the NAS. I think we may have tested important support at the
50-day MA and the 20 day EMA. If that support doesn’t hold it would likely lead
the markets lower. If we break this level, on the downside I would expect
support near 2000 to be tested. Another indicator to watch is the RSI line. On
most major indices it is testing support near 50. If we break this level it
would indicate weakness.
Portfolio Strategy: Right now we are very close to delta
neutral. Also, our April options expire on Friday. Once we get clear market
direction, we will likely peel back our in the money options. As well, I’m
going to run a tight stop to the downside on the cash Dow today, as well as a
stop over the market. I’m going to watch the market set-up and then issue an
e-mail update to members.
Yesterday’s results and current portfolio status:
Daily Profit: $310
9700 April Mini Dow Put
Options: We are long 2 put options. Yesterday they settled at 1, down 1 (each
point is worth $5). Loss on the day with this position was $10.
9900 May Mini Dow Put
Options: We are long 2 put options. Yesterday this option settled at 65, down
9. Loss on this position was $90.
10000 April Mini Dow Put
Options: We are short four put options. Yesterday this option settled at 1,
down 6. Profit yesterday with this position was $120.
10400 April Mini Dow Call
Options: We are short two call options. Yesterday this option settled at 35,
down 5. Profit yesterday with this position was $50.
10400 April Mini Dow Put
Options: We are short two put options. Yesterday this option settled at 60,
down 24. Profit on the day with this position was $240.
Mini Dow Futures: We are
now flat the mini Dow future.Â
Charts from
www.stockcharts.com Â
Trading Method:Â Mark Melin strategically short sells options and then
directionally trades within this short options portfolio, always hedging one
position against another to generate consistent profits.
DISCLAIMER:
Past performance is not necessarily indicative of future results.
There is a substantial risk of loss in commodity futures and options trading.
It is not suitable for all investors. Only you can determine whether this
trading suits your particular needs and risk tolerance.
All profit and loss representations are hypothetical and based on the Real
time signals generated by The Dow Trader. The results have not been adjusted to
reflect slippage or commission charges. No representation is being made that
any account will or is likely to achieve profits or losses similar to those
shown.
