Time-Frame Traps
Do you analyze your
trade setups
in one time frame, but make your buying and selling decisions in another? This
“trend relativity error” can empty your trading account with great
precision.
All trade preparation and management takes place within three-dimensional
trend relativity. Simply stated, a single trend exists only within the time
frame that it appears. This trend does not predict direction in the time frame
above it until price crosses a key level of the longer period chart. This
complex relationship persists all the way from one-minute through yearly chart
analysis.
Here’s a classic example of a trend relativity error in action. You see a
nice uptrend on your 60-minute chart. The stock bases nicely and you decide to
enter, waiting for the next breakout. But you fail to notice that the 60-minute
base has formed just below massive resistance on the daily chart. The stock
suddenly rolls over and takes you with it.
Here’s how to avoid this common pitfall. Most profitable positions will align
to support-resistance on the chart above the trade and utilize low-risk entry
points on the chart below. Begin with a sharp focus on the next direct move
within your predetermined holding period. Look at the charts above and below the
one that shows the setup. Establish a price target based on your holding period
and all of the obstacles price must cross to get there. Enter your trade when
reward:risk looks good, but then reevaluate the charting landscape bar-by-bar to
confirm that you haven’t missed any hidden barriers.
Few executions align perfectly through multiple time frames. Successful
trading requires a careful analysis of conflicting information and entry when
favorable odds rise to an acceptable level. If you see a good setup in one time
frame but marginal conditions for those surrounding it, evaluate the overall
risk and execute if the reward:risk moves into a tolerable range. That’s the nature
of the trading game.
Let’s see trend relativity in action by looking at this week’s trading on
Checkpoint Systems
(
CKP |
Quote |
Chart |
News |
PowerRating).
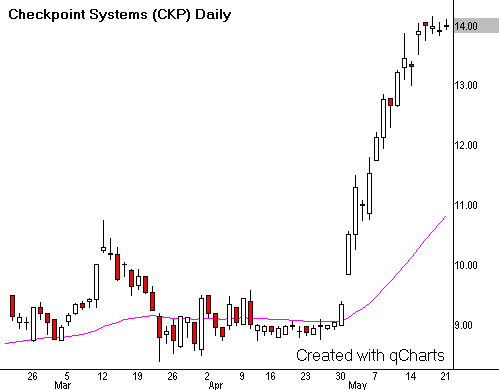
The daily chart shows how Checkpoint explodes out of a one-year base at the
beginning of May and ejects into a 50%+ rally that lasts about 10 trading
sessions. It then congests at the top of its range and points straight to the
sky.
Signals went off at Hard Right Edge when CKP printed an NR7 buy signal on
5/21. This “narrowest range of the last 7 bars” often precedes a
dynamic breakout move. It is especially bullish when it occurs at the top of a
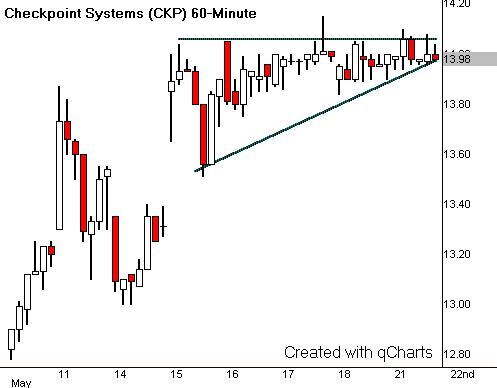
sharp rally. Dropping down to this 60-minute chart supported the bullish
analysis. A tight ascending triangle had all the markings of a stock ready to
head to higher prices.
Unfortunately, Checkpoint had other plans.
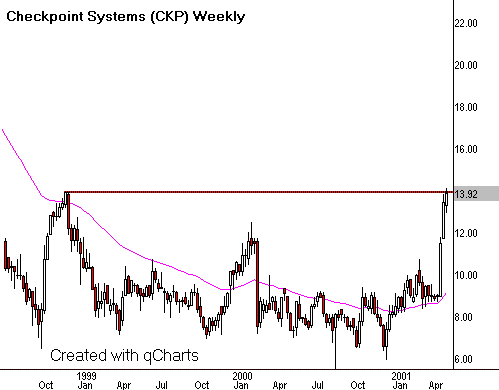
How many of us would have missed the late 1998 high on this weekly chart?
Most software would reveal this vital information only if we had it set to a
very long-term view. The reality is that modern traders tend to get so involved
in the present that they never look at vital clues from years past. In the case
of Checkpoint, trading that took place two-and-a-half years ago carried the most
important data on the ultimate success or failure of our position.
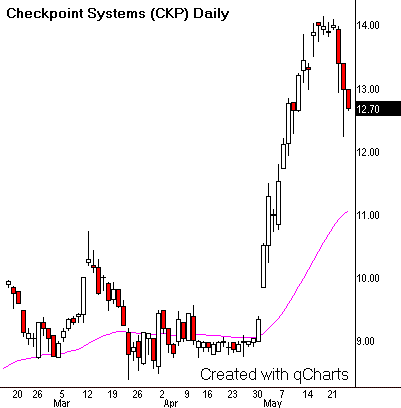
Trend relativity shows its awesome power as the stock suddenly breaks down
into a correction. There is some debate on the persistence of highs and lows
that took place many years ago. But there is little doubt on this chart that CKP
is reacting to resistance that many of us would have thought no longer existed.
The good thing for traders is that the NR7 signal works in both directions.
Place an entry stop just outside the narrow bar and follow the market in
whatever direction it decides to go. Or use a simple pattern failure technique
and sell a break of the ascending triangle’s lower support.
Hard work yields promising setups that align to the swing trader’s holding
period. But these opportunities must fit into a larger market structure for the
position to succeed. With trends in motion less than 20% of the time through all
markets, odds do not favor a confluence of favorable trading conditions through
three time frames. The perfect opportunity rarely exists. An exciting breakout on
one chart may face massive resistance on the longer-term view just above a
planned entry level. Or a shorter-term chart displays so much volatility that
any entry becomes a dangerous enterprise.
Trend relativity errors rob profits on good entries as well. No one wants to
leave money on the table. So marginal players may freeze as soon as a new
position moves in their favor. But inaccurate price targets can measure one
trend while the initial entry springs off another. Natural wave motion then
whipsaws the flawed position sharply and sends the trader into a substantial
loss well before reaching a reward.