Tuesday’s Levels
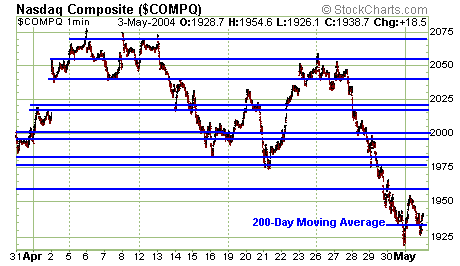
Monday Recap: On Monday, the NASDAQ held sway. The tech
index started the day by testing its 200-day moving average – and at the same
time the Dow and S+P were only modestly higher. After breaking it’s 200-day
moving average, the NAS quickly sprinted up some 2% on the day trading just
below resistance near 1960. Then just after lunch, the NAS broke lower, trading
below its 200-day MA before bouncing into the close to close above the 200-day
MA.Â

                    Â
Charts courtesy of StockCharts.com
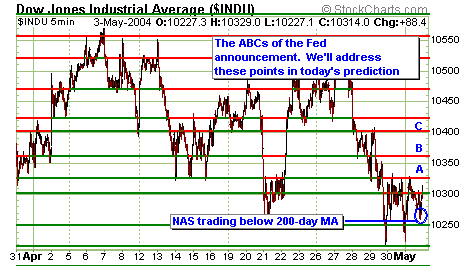
Like the NAS, the Dow started the day higher. It wasn’t until the NAS broke
it’s 200-day MA on an intraday basis that the Dow and S+P got some serious legs,
taking these indexes right into resistance near 10330 on the cash Dow. Later in
the afternoon, when the NAS moved lower and traded below its 200-day MA, the Dow
and S+P followed, with the Dow finding support just above 10250 before bouncing
into the close to end the day at 10314, up some 88 points on the day.

^next^
Prediction for Tuesday: Fed chairman Greenspan will likely
rule the day. Most predictions have the wording of their statement changing
significantly, reflecting a strong, near-term desire to move interest rates
higher. However, while I think the wording will change, such as the “patient”
language in their statement, I think there is a chance the statement could
surprise with language relatively tame when compared to expectations. If this
occurs it could propel the markets to move into higher levels. In my mind the
key component to look for is how the Fed views inflation. If the Fed views
inflation as a major concern, then watch out below…
One way we can
determine how the market has digested the 2:15 EST Fed announcement is to look
at how high/low the Dow travels after the announcement. In the five minute
chart we presented at the start of this report we highlighted three points: A, B
and C. An announcement slightly better than expected would take us past point A
and into the B level. A very good announcement and we could take us up to much
more significant resistance near C on the chart above. Â

On the Dow we’ll first watch the 10330 level.Â
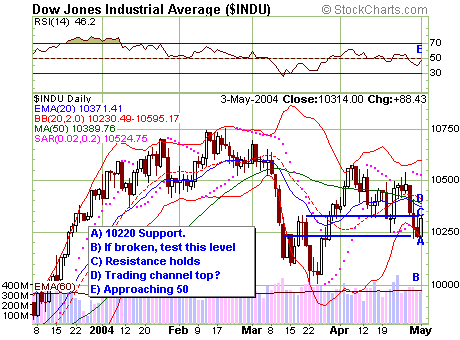
This could provide a trigger point of sorts and an indication that the market is
going to move from resistance (C) we could see a move into moving average and
chart resistance (D). Here we’ll keep an eye on the 20-day EMA currently near
10371, the 50-day MA near 10389 and then chart resistance near 10400. A break
of this level might require us to change our outlook on the market and then look
for a test of the recent top near 10550. If we see downside action, we could
see a test of 10250-20 region. If this level breaks it could indicate a move
lower. Â
Portfolio Strategy: I’m going to
want to get the portfolio close to neutral for today’s announcement. We’re
likely to purchase mini-Dow futures hopefully at lower levels before today’s Fed
announcement.Â
Yesterday’s Results and Current Portfolio
Status:Â Â
Daily Loss: $205
Â
10100 May Mini Dow Put Options: We are short 2 put options. Yesterday this
option settled at 62, down 38. Profit yesterday with this position was $380.Â
Â
10100 June Mini Dow Put Option: We are short 2 put options. Yesterday it closed
at 147, down 40. Profit yesterday with this position was $400.
Â
10600 May Mini Dow Call Options: We are short 2 put options. Yesterday this
option settled at 20, up 5. Loss yesterday with this position was $50.Â
Â
10600 June Mini Dow Call Option: We are short two call options. Yesterday it
closed at 83, up 21. Loss yesterday with this position was $210.
Mini Dow Futures: We came into the day short two
mini Dow futures. We bought one mini Dow future at 10260 and sold it at 10294.Â
Yesterday it settled at 10292, up 89. Loss yesterday on this position was
$725. We are now long two mini Dow.Â
Â
Trading Method:Â Mark
Melin strategically short sells options and then directionally trades within
this short options portfolio, always hedging one position against another to
generate consistent profits.
For questions and
comments send an e-mail to
subscriptions@dowoptionstrader.com
DISCLAIMER:
Past performance is not necessarily indicative of future results.
There is a substantial risk of loss in commodity futures and options
trading. It is not suitable for all investors. Only you can determine
whether this trading suits your particular needs and risk tolerance.
All profit and loss representations are hypothetical and based on the real
time signals generated by The Dow Trader. The results have not been
adjusted to reflect slippage or commission charges. No representation is
being made that any account will or is likely to achieve profits or losses
similar to those shown.Â
