Using Ascending Triangles In Daytrading
Daytraders can use the same patterns from the
daily charts that swing traders do, but with the intention of opening a position
based on the initial breakout rather than the continuation the following day.
The ascending triangle is a perfect example of such a pattern.
The Ascending Triangle
Defined
The ascending triangle is a pattern which can
build up over several days or several weeks, and it traces itself out on a
chart in a shape exactly like the name describes. Working with all lengths of
price bars, from five-minute to daily bars, it’s equally powerful in any
time frame. Like most patterns, the breakout potential is greater in those
patterns that form over a longer period of time.
An ascending triangle is formed when a specific
resistance level is tested a minimum of three times, but ideally at least five.
During this testing period, each price bar following the initial test shows a higher
low than the last. This type of price action shows that traders and
investors are willing to pay a higher price on each pullback to open a position.
As with any pattern, the occasional anomaly in
price action is acceptable. Thanks to recent volatility, fewer and fewer textbook
examples of chart patterns are appearing, and technical analysts are forced to
loosen their definitions of acceptable triangles.
Using the Ascending Triangle
For Daytrading
Often in my columns you’ll notice that I
mentioned that swing traders should wait to open a position on the day following
the breakout, because so many moves only last for one day and fail. These
moves are what I refer to as “false breakouts.” Daytraders, on the
other hand, are usually looking to go home flat at the end of each day, and thus
are not subject to many of the problems resulting from holding failed breakouts
from daily patterns overnight.
Retracements and Stop
Placement
Often following a breakout move, a stock will
retrace. When the breakout results from an ascending triangle formation, the
stock should find support at the breakout level, because former resistance
becomes support. For this reason, I place my initial stop roughly 1/4 point
below the top of the triangle. In a situation when the low of the day prior to
the breakout is not more than 1 1/4 points below the top of the triangle, I will
place my initial stop underneath that low.
Real World Examples
An ascending triangle can be based on a
combination of intraday and closing prices. I use a 1/4 point move above the top
of the triangle for my daytrading entry.
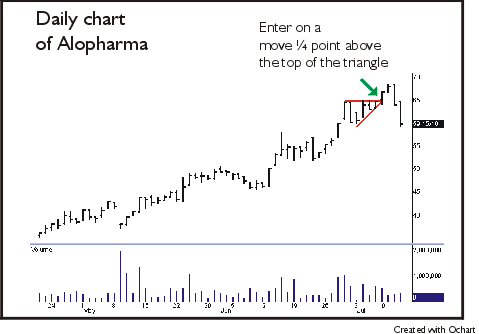
In the case of Alopharma
(
ALO |
Quote |
Chart |
News |
PowerRating), an ascending
triangle formed over a six-day period. The stock was unable to break through 65
after five attempts. On the sixth day, the stock opened in a position that formed
the fourth higher low. Intraday, it broke out above resistance and I entered my
order when a trade was executed at 65 1/4, which was 1/4 point above the
resistance level. I filled a bit higher due to the larger-than-average spread.
The stock peaked at 66 7/8 that same day.

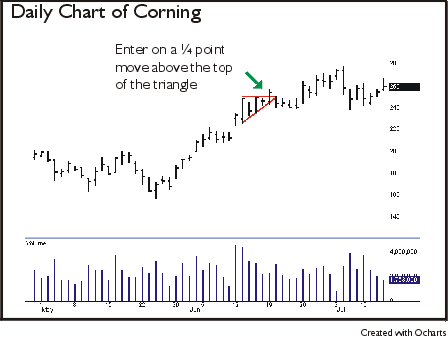
In a second example, Corning
(
GLW |
Quote |
Chart |
News |
PowerRating) shows us an example of a four-part
triangle. This
example demonstrates that it’s not always necessary for the triangle to reach
its apex before exploding. In this case, the top of the triangle was 250. On the
fifth day of consecutive higher lows, Corning broke out of the pattern and moved
to an intraday high of 257 3/16, offering a substantial point return for a daytrader.
Keep in mind that many daytraders think in terms of point gains and point
losses, as opposed to percentage moves. Note how risk was minimized by closing
out the position by the use of a trailing stop. Traders who held over until the
following day would have given back their gains.

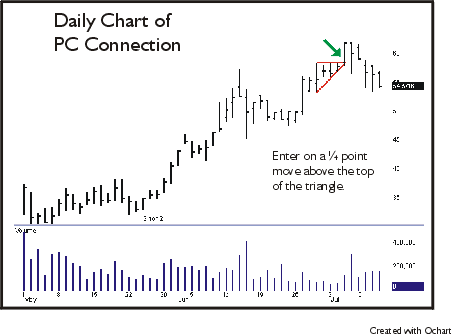
PC Connection
(
PCCC |
Quote |
Chart |
News |
PowerRating)
provides a unique example. In this case, after the large-range day (the first
day of the triangle), a near-term top was established. The following three days
did not show a series of consecutive lower lows, but rather a short-term
consolidation. Because it’s so rare to find textbook examples of chart patterns,
it’s important to loosen the definition from time to time. I still consider a
triangle in an ascending pattern if at no point does a price bar take out the
low of the left side of the triangle.
The top of this triangle
was at 58 1/2. Entering on a 1/4 point move above the top of the triangle
created the potential for
a 3 1/2 point gain at the close. The stock peaked at 62 that day, and closed
3/16 lower, at 61 13/16.

Conclusion
The
ascending triangle, while a seemingly simple pattern, offers quite stunning
opportunities. The breakouts resulting from this formation can be significant.
The key to the pattern is to never disregard a chart because it does not meet
the specific requirements of the textbook pattern. It also reminds daytraders to
look not only at the intraday moves, but to also take advantage of moves based
on bigger-picture setups, in this case, the daily charts.
For The Best Trading
Books, Video Courses and Software To Improve Your Trading
