Using Inverted Cup-With-Handles To Identify Shorting Setups
Traders have long known that many
buy-side chart patterns can be inverted to
time short entries. For even better results, we’ve also learned to turn the fundamental picture on its head as well: weak or deteriorating corporate performance for shorts vs. strong or improving fundamentals for longs.
The medium-term trader who knows how to combine inverted patterns and negative fundamentals to spot short trades can turn a profitable side business in bear markets while the one-sided long traders are confined to the sidelines.
However, shorting off inverted
patterns involves more than just applying your technical and fundamental rules in reverse. For one thing, short-selling
involves the uptick rule (although there is talk of repealing this restriction).
The trader must also take into account the nature of fear. Fear is not the mirror image of greed. Fear tends to produce sharper moves,
both to the downside and in short-covering rallies, than greed
produces in upside stock moves. So the trader often must contend with
greater volatility following short entries than occurs after long entries. As we’ll see, this means taking smaller positions and allowing wider price stops when you short than when you go long.
In this report, I am going to teach you how to combine pattern, trend and fundamentals to sell short using one of my favorite patterns: the inverted
cup-with-handle. This is a natural short-selling setup for traders
who are already familiar with the normal cup-with-handle. The logic behind both
patterns is nearly the mirror opposite, making it easy to grasp one if you fully
understand the other. But there are important exceptions.
If you’re unfamiliar with
short-selling, I recommend you first read Dave Landry’s report, Shorting
Stocks: The Art of Playing Both Sides of The Market. Then this report
will make much more sense to you.
You also should have a good grounding
in the normal or buy-side cup-with-handle. For examples and interpretation, see
my reports The
Psychology of Chart Patterns and Using Volume: The Key to Price & Liquidity.
Trend
Continuation
This report is meant for the intermediate-term momentum trader who seeks
to hold on for advances or declines lasting weeks to months. So let’s get one thing clear. The pattern itself can look picture perfect, but a
strong prior trend must be in place. There are valid ways to use the pattern as
a reversal pattern off a bottom or a top,
but that’s not the classic way that
momentum traders put the pattern to use. We
use the cup-with-handle and its kin as continuation
patterns to time our entry into stocks that we hope are about to
resume a strong prior trend.
Consequently, I go long off a
cup-with-handle only if the overall pattern occurs in the context of a strong
prior uptrend, a method popularized by the legendary William O’Neil, who
developed many of the modern rules for exploiting the cup-with-handle and its
shallower cousin, the saucer-with-handle. The hope is that the uptrend will
resume following the breakout to the upside.
Similarly, I go short off inverted
cup-with-handles only in stocks that have well-established strong prior
downtrends. The hope is that the stock will resume its downtrend following the
breakout to the downside.
Price trend is so important that I
want the relative
strength line to share the same direction as the price
trend. A rising RS line for longs; a falling RS line for shorts.
My first acquaintance with this
inverted pattern came in reading William Jiler’s 1962 classic, How
Charts Can Help You in the Stock Market, an insightful little classic
first published in 1962. However, Jiler largely treated the pattern as a topping
or reversal pattern. I pretty much owe my rules to trading the pattern to Mark
Boucher, who uses the inverted cup-with-handle as a continuation pattern to time short entries
into stocks in well-established downtrends. No two
traders trade exactly alike. As I go along, I’ll explain some differences in our
trading methods. You can choose or modify the approach that fits you
best.
Inverted
Cup-With-Handle
In the case of the inverted cup- or
saucer-with-handle, you are looking for a stock that is in a major downtrend. So,
it must have come off significantly from its all-time or 52-week high. Stocks in
major downtrends are likely to continue, but just buying stocks making new lows
can get you into trouble. At some point, a stock will find its bottom, and by
buying just on a new low, you could go short just when powerful value investors
and other bottom-feeders are moving in for the kill, producing a rally in the
stock. You also could run into a short-covering rally. Even if a stock is ultimately headed
lower, short-covering can produce vicious upside reactions that will stop you out of your position.
The inverted cup-with-handle helps to
reduce the odds of running into this scenario. J.C.
Penney
(
JCP |
Quote |
Chart |
News |
PowerRating) traced the pattern in 1999, broke out and fell to lower lows.
The top field of the following charts
uses a logarithmic price scale and displays a 50-day price average line in red.
In the second field, a blue
strength line represents
the displayed security’s price performance relative to the S&P 500. The
third field displays vertical daily volume bars with a 50-day moving average
line in blue for volume.
A stock is in a major downtrend. At
minimum, it should be significantly off its all-time or 52-week high and trading
below a downward-sloping 50-day moving price average. All the better if the
stock also is trading below a 200-day moving price average. The relative
strength is sloping downward, confirming the price downtrend.
At some point, the stock reverses off
a new intraday price low (see Point a in the
following chart) and stages a reaction to the upside. This probably
reflects a blend of buying demand from short covering, as well as long trades by
investors betting on a bottom, and briefer-term players. This countertrend move
should carry the stock high enough that it crosses above its 50-day moving
average. It’s fine if the stock crosses above the 200-day as well. Then the
stock loses steam, peaks (Point b), starts
to give ground and heads back to earth. This move have served to clear out the
last big round of short-covering.
You should not look for a proper
handle to form until the market price has dropped to the
midpoint between the pre-reaction low (Point a)
and subsequent peak (Point b). To find this
midpoint, simply add the low and peak prices together and divide by two. The lower
the price falls down the right side the better, as each price move down
increases the evidence that the countertrend rally has been broken and the last
influx of buyers are coming under increasing pressure to sell. Handles that form
higher in the pattern are premature.
At some point after the stock falls
below the midpoint, it stops falling and starts to reverse upward again (Point
c). Now the stock puts in a handle, which
could be fomented by another around of short covering, as well as a new set of
long buyers betting that the stock has found a bottom. Also, short-selling and
selling may have dried up as people anticipate the stock is approaching resistance. Whatever the causes, the stock rises, starting the handle. This
time the upward move is inferior to the prior a-b reaction. The stock peaks
again and falls anew, indicating
that this secondary reaction has failed as well.

As the stock drops again, get ready. The low
of the handle is the key to your pivotal point. As soon as the stock crosses below that price
point (Point d), you sell short, setting
your initial price stop just above the high of the handle.
While you can go as short as five
weeks, the whole pattern really
should take at least seven weeks to form, from beginning
(Point a) to breakout (Point
d). In the J.C. Penney example, the stock formed its inverted
cup-with-handle over seven months. There is no maximum percentage depth of the
cup (vertical depth distance from “a” to “b”). This differs from the normal (buy-side) cup-with-handle, where
extremely deep bases are faulty and prone to failure.
Now let’s take a closer look at the
inverted handle in the following chart. As with normal handles, sometimes the
inverted handles can get a little wily, sending you an entry signal only to stop
you out, but then set right back up and send a second valid signal that works
out. That happened here.
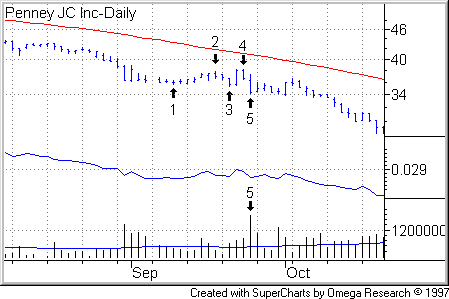
As you can see, J.C. Penney’s stock
falls down the right side of the cup, makes a final low on Sept. 9 (Point
1 in the following chart), then starts to wedge upward, beginning the
formation of the handle. The handle peaked on Sept. 17 (Point
2), which forms the basis for your initial price stop. Then the
handle returned south and on Sept. 21 (Point 3)
broke below the Sept. 9 low. So you got short.
However, the stock wasn’t quite ready
to give up the ghost. It reacted to the upside. As it exceeded the high of the
handle (Point 2) on Sept. 22 and Sept. 23 (Point
4), you would have been stopped out. Despite this stop-out, the
handle remained intact with the Sept. 23 session printing a new high for
the handle. On Sept. 24 (Point 5), the stock
broke below the lows of the handle, this time on more convincing price range and
volume expansions. You go short again here, setting your stop a tick just above
the high of the handle (Point 4).
Ideally, the downside breakout will occur on a surge in volume, indicating that the break below
support has sent shareholders on the run. However, a valid downside breakout
also can occur on average volume (as averaged over the past 50 sessions) in a
sign that buying has shriveled up relative to selling.
Mark Boucher wants to see his
breakouts (for long as well as short trades) occur on a lap, gap or thrust. On a
lap-down day, the stock opens below the prior session close and does not fill
the space between the session’s highest high and the prior day’s close. On a
gap-down day, the stock opens below the prior session intraday low, and the
intraday high overlaps the prior session’s intraday low.
On a down-thrust day, the stock moves
lower on a significant price-range expansion and closes near the low of the
range. Mark wants the range expansion on the breakout day to be at least double
the average daily range of the previous 20 days. I’m not that mathematical. If
the price-range expansion looks vigorous to the eye, as it does in the J.C.
Penney breakout (Point 5), that’s good
enough for me. I also like to enter my positions as soon as the stock hits my
pivotal point (a tick below the low of the handle). So, I probably won’t know
whether a session produces a thrust or significant volume expansion until after
my order is filled.
The following chart of Dillard’s
(
DDS |
Quote |
Chart |
News |
PowerRating)
provides another example of the inverted cup-with-handle. The pattern started on
Oct. 27, 1999, formed the handle low on Feb. 17, 2000 (Point
a), with the breakout on Feb. 24 (Point b).

Fundamental Screen
I do not apply strict fundamental criteria to gap-down shorts. If the downtrend is strong and confirmed by a downtrending relative strength line, I’ll consider shorting the stock regardless of the fundamentals. But it should go without saying that
declining earnings or rising losses and high valuation add credibility to a short candidate.
If you want a specific fundamental screen for shorts, I recommend you use Mark Boucher’s
down-fuel criteria. A short candidate should have either:
- A decline in annual earnings and an estimate of either an annual loss or another decline in annual earnings, plus two quarters of declining earnings or of negative quarterly earnings;
- or two quarterly earnings down 40% or more, or two negative quarterly earnings with an acceleration in the decline.
Mark also likes his short candidates pricey, leaving ample room for valuation contraction. By his book, a good short candidate should have a price-to-sales ratio greater than 10 and/or a price-to-earnings ratio greater than the P/E on the S&P 500.
Initial Position
Management
Many intermediate-term momentum
traders used fixed percentage price stops to protect themselves in case a stock
turns against them. This is fine when trading the long end. Bill O’Neil has
called for initial price stops of 7% to 8% of your cost, which assuming you are
finding valid patterns and executing your trades decisively after you pivot is
hit, should keep you in plenty of winners while minimizing stop-outs from
losers.
However, short-selling is a different
matter. Short-covering rallies in downtrending stocks can be quite
violent. Even an initial price stop of 15% percent of your cost will bounce you
out of too many trades to make a profitable business of shorting the inverted
cup-with-handle.
In order to ride out this added
volatility, you should set your stop a tick above the high of the inverted
handle (Point 4 in the above two chart). Of
course, this means that many times you will wind up assuming more risk to stay
in a position than would be the case if you used, for example, an 8% stop. So
you should reduce position your position to keep the overall exposure of the
position to your portfolio constant.
As a general rule, you should risk no
more than 1% or 2% of your total portfolio on any single position, long or
short. Now don’t get confused. When I say not to “risk” more than 1%
or 2% on any single position, I don’t mean “allocation.” I mean the
percentage amount you will allow a stock to move against your position before
you cover your short or sell your long.
For example, let’s say your account
equity totals $500,000 and your maximum risk per position is 2% of your total account
equity. Your maximum monetary loss per position is $10,000. So imagine that you
plan to short shares in XYZ Company. The stock is forming an inverted
cup-with-handle. Assume your pivot point is 20 and your initial stop above the
high of the inverted handle is 24, representing a theoretical loss of 20% of
your original capital committed to that particular trade.
Divide maximum account loss per
position ($10,000 in this case) by maximum loss per trade (20% or 0.20), and you get
your allocation (position size) for that trade ($50,000). The greater the risk,
the smaller the position. The smaller the risk, the greater the position.
For more on this aspect of money
management, see my report Adjusting
Stops for Volatility.
Profit-Taking
If a shorted stock rallies on you and
hits your initial stop above the high of the inverted handle, you cover your
short and take the loss. No regrets.
Assuming the stock heads south and
becomes a profitable trade, you need a different plan for profit taking. Because
of the danger of sharp countertrend reactions throughout the life of a short
trade, I recommend that you take half profits
as soon as you have a 20% to 25% profit in your trade while letting your
remaining position ride. This should get you to breakeven in the event a
subsequent short-covering rally stops you out. So in effect, you’re using the
“house’s money” to finance your wager.
You also should move down your
protective stop on your remaining position to breakeven as soon as is practical.
Here’s a good technique for successful trades: You short a stock on a breakout
from an inverted cup-with-handle, and the stock falls, creating a profitable
position. You take half profits at 20%. The stock falls a bit more, then
rallies. Give the rally six days, sufficient time for the stock to digest any
short-covering.
At the close of the sixth day, Mark
Boucher likes to bring his down to either the high of the countertrend rally
or to your breakeven point. From there, once you have a profit that you want to be sure to
protect, you can use a mechanical trailing stop.
These are very sound rules. Like
Mark, I often take half profits in long as well as short trades, but I am more
discretionary in how I handle the remaining position, as opposed to adhering to trailing stops. You choose the approach that best suits your style of trading, but however you take profits, be sure that you take measures to protect the bulk of your original capital. Small losses and stop-outs are an inevitable part of trading. But you should always guard against big losses.
Other Pattern
Considerations
In passing, I might note that other
traders have found different ways to trade the normal and inverted versions of
the cup-with-handle, saucer-with-handle and Japanese fry pan described by Steve
Nison in Japanese
Candlestick Charting Techniques. Some use it as a topping or bottoming
pattern rather than as a continuation pattern.
These approaches, while valid, are not
generally recommended if you trade exclusively according to intermediate-term
momentum principles. If you are new to trading, I think it’s
a poor idea to try to trade significantly different styles — such as short-term
and intermediate-term — at the same time. You are blending conflicting elements of
both styles and creating a losing mutation rather than a coherent strategy.
For instance, I’m a big fan of Dave Landry, a
savvy short-term and swing trader, but some of his pattern methods don’t fit
with my intermediate-term approach. Dave uses low cup-with-handles as well as high
cup-with handles. Since I am seeking to enter and hold out for profitable moves
lasting weeks to months, I rule out low cup-with-handles because of the risk of
running into selling from overhead supply over the intermediate term, a factor
that poses less of a problem for short-term trades.
With that caveat, you still can gain insights by looking at how other traders exploit these patterns. For more on how Dave’s take on the
cup-with-handle as well as his take on pattern inversions, check out his reports
How To
Use Inverted Long Patterns to Find Shorting Setups and Cup-and-Handle
Trading Techniques For Swing Traders.