Using Moving Averages And Patterns To Enter Into Fast Moves
The
main focus of my work involves the use of short- to
intermediate-term technical strategies in Exchange Traded Funds (ETFs) and
futures markets. In the following
lesson I will show you how I translate the basic principle of trend into a
simple moving average and bar pattern combination, which I call the Incipient
Trend Pattern (or ITP). I use this technique for the purposes of
early trend identification, and to help establish favorable trade location.
The accepted definition of a trend is a series of higher peaks and
higher troughs in price. On a bar
chart, this normally takes on the appearance of a series of either ascending
or descending zigzags or waves. In a
non-trending market, price peaks and price troughs are more evenly distributed
across the horizontal axis. However,
despite this uncomplicated description, the task of sorting out and
identifying trends can still be problematic. Confusion
usually arises over the “degree” of trend one is attempting to
isolate. What is needed is a method to
help qualify trend in a consistent manner.
All moving averages lag behind price. Therefore
once a stock’s price has crossed and closed above or below its average, it is
presumed the stock has already gathered directional momentum, and has entered
the “incipient trend” stage. Thus,
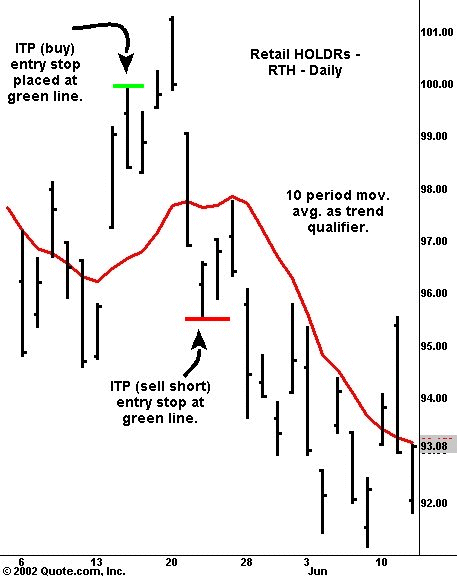
ITP begins with a ten-period simple moving
average as a trend qualifier.
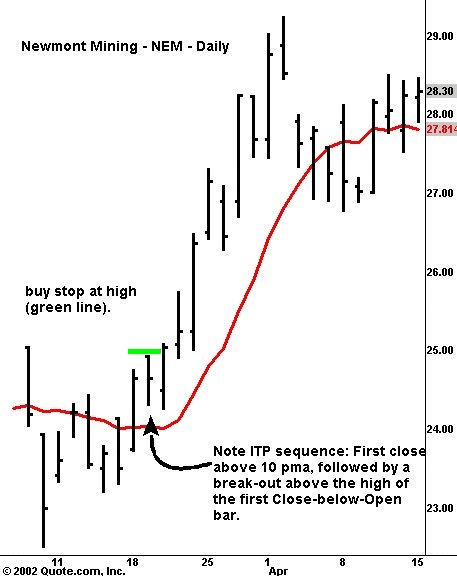
Following the first occurrence of a close above or below the average, I begin
watching closely for a pause with specific characteristics.
The pause serves to confirm the incipient trend, as well giving us the
parameters for entering and managing the trade.
For long candidates, a “contra” open-to-close sequence bar, whereby
the day’s close is below the open, initiates the pause.
This pattern is reversed for short candidates.
I have found that the best signals occur when the pause contains only
one bar, as just described. However,
following the first contra bar, there may be up to four additional bars (five
bars total) that make up the pause. The
open-to-close sequence of these additional bars is not important.
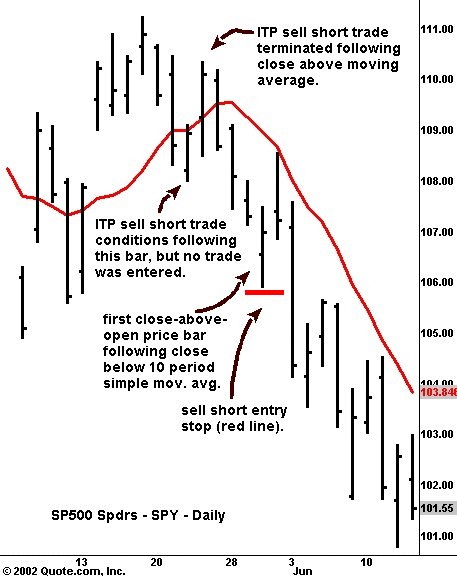
None of the bars may close below the moving average (for buys) or above
the moving average (for shorts). If
a bar closes above or below the moving average prior to trade entry, the setup
is abandoned.
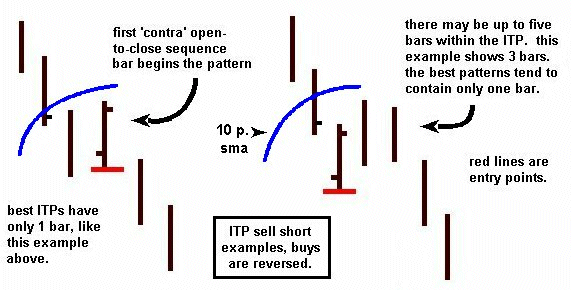
The trade is
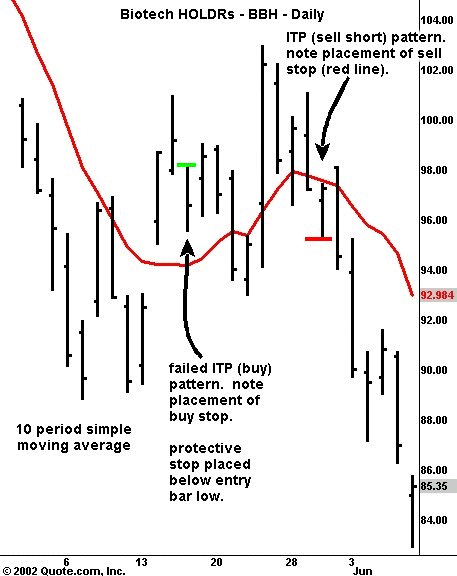
entered on a buy (sell) stop-limit order at the high (low) of the contra bar.
The protective stop is placed at the lowest low or highest high of the
pattern. I normally exit these trades
with either a trailing stop, or through support and resistance targets.
Examples of this moving average/flag pattern combination can be found in daily
charts of both stocks and commodities. I
do not use this technique on intraday charts due to the noise factor in high
frequency data. Another clue to finding
good signals with ITP is to look for
signals that occur early after a trend reversal, i.e., where the moving
average has recently switched from a negative slope to a positive slope (vice
versa for sells).
Like any technical pattern, ITP is not
intended as a means to an end. My goal
is always to enter positions as near as possible to the point in time where I
believe the market is ready to begin moving favorably.
Thus ITP represents a technical
“bookmark” which holds my place on the chart while I frame out a
trade.
For The Best Trading
Books, Video Courses and Software To Improve Your Trading
