Wednesday’s Levels
Tuesday Recap: We had a good day
Tuesday with a profit of $240.
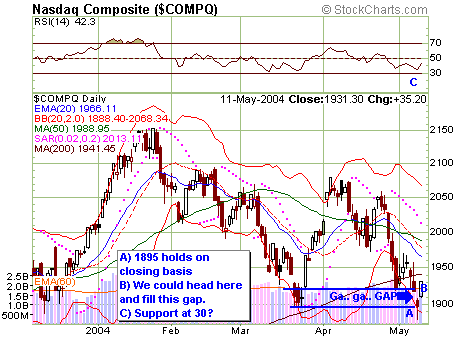
The index of the day yesterday was the NASDAQ,
powering up some 35 points to end at 1931. The tech leader was clearly the
strongest major index, up a stiff 1.8% on the day. Below you’ll see the exact
prediction chart that was posted yesterday morning, with the edition of today’s
prices. You can see the NAS filled the gap, hit our target (B) and then powered
past resistance. You’ll also note that the tech index found RSI support at 30.
This action was an important development for the market as a whole and we have
several comments on the NAS and what it could mean for the market as a whole in
today’s prediction section. ‘
The S+P was also a strong performer, up close to
eight points or .77% on the day, while the Dow was the day’s laggard, up only
.29%. You would think that because I called a 10000 bottom and positioned our
Dow options portfolio positively Monday afternoon I would be disappointed by
Tuesday’s price action, but in fact the NASDAQ’s leadership is encouraging for
the market at large.Â
^next^
Prediction for Wednesday:Â We
will likely drift on both sides of the flat line with an upside bias until we
get the inflation numbers on Thursday and Friday.Â
Overall I’m cautiously bullish on the market.Â
This is due to the fact that the NASDAQ is leading this market higher – that’s
why I’m not that upset with the Dow lagging this market. However, I would like
to see some additional volume on moves higher.Â
 Â
Â
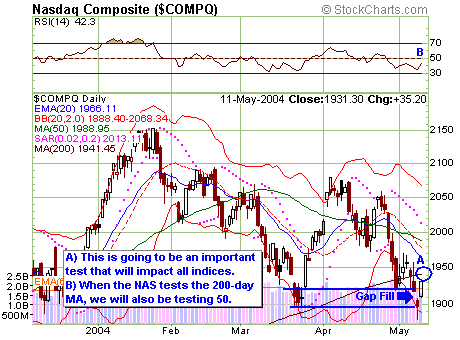
On the NAS we’re going to watch for a critical
test that could impact the rest of the market. When the NAS tests its 200-day
moving average, this test could hold the fate of the Dow and S+P. If it clears
and holds its 200-day MA, it will likely lead all markets higher. If it can’t
break and hold, the markets will likely be taken lower. Â
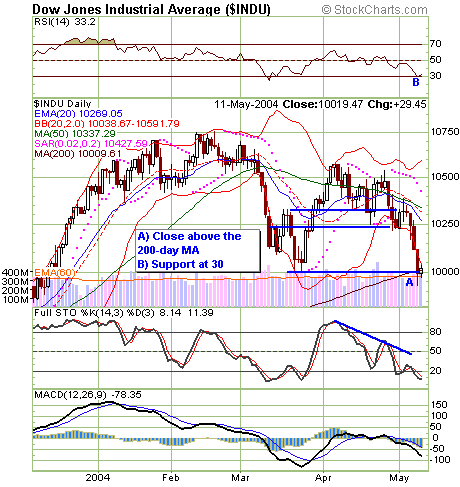
On the cash Dow, we’re going to watch for a break
of light resistance at 10050. If that level holds, we could see a test of 10170
and then potentially a more significant test near 10220-50.  On the downside,
we’ll watch the 200-day MA on a closing basis, along with 9975 and 9950. A
close under 9950 would mean things are going in the other direction. Below
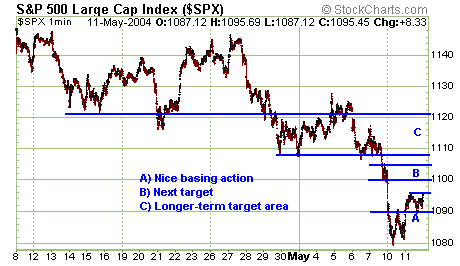
you’ll see a chart of the S+P. If we get good inflation numbers I think we
could test the C level on the chart.Â
Portfolio Strategy:Â Right now
we are delta positive. We will remain positive until we reach our 10170
target. At that point we will re-assess the market. A close under 9950 would
cause us to change the delta of our portfolio. Â
Yesterday’s Results and Current Portfolio
Status:Â Â
Daily Profit: $240
Â
10100 May Mini Dow Put Options: We are short 2 put options. Yesterday this
option settled at 175, down 30. Profit yesterday with this position was $300.Â
Â
10100 June Mini Dow Put Option: We are short 2 put options. Yesterday it closed
at 264, down 34. Profit yesterday with this position was $340.
Â
10600 May Mini Dow Call Options: We are short 2 put options. Yesterday this
option settled at 3, up 1. Loss yesterday with this position was $10.Â
Â
10600 June Mini Dow Call Option: We are short two call options. Yesterday it
closed at 20, up 3. Loss yesterday with this position was $30.
Mini Dow Futures: We came into the day short two
mini Dow futures. We bought one mini Dow at 9991. Yesterday it settled at
9985, up 33. Loss yesterday on this position was $360. We are short one
mini-Dow.Â
Trading Method:Â Mark Melin strategically short sells options and then
directionally trades within this short options portfolio, always hedging one
position against another to generate consistent profits.
Â
For questions and comments send an e-mail to
subscriptions@dowoptionstrader.com
DISCLAIMER:
Past performance is not necessarily indicative of future results.
There is a substantial risk of loss in commodity futures and options
trading. It is not suitable for all investors. Only you can determine
whether this trading suits your particular needs and risk tolerance.
All profit and loss representations are hypothetical and based on the real
time signals generated by The Dow Trader. The results have not been
adjusted to reflect slippage or commission charges. No representation is
being made that any account will or is likely to achieve profits or losses
similar to those shown.