Whoop! There It Is!
In a bold
move by the Federal Reserve in what was the first interest rate
drop in the past two
years, the major market indices put the pedal to the metal
at mid-session and closed near their highs. After giving the “one-finger
salute” to the Bears and the gloom-and-doom crowd, the technology
sector put on the fiercest
run I’ve ever witnessed, undoubtedly crushing unsuspecting
shorts in its wake.
When I saw one of the commentators on
a well-followed financial broadcast this
morning give lessons on how to short stock, I started looking for long
entries. Without
a doubt, the herd psychology was banking on a move in the Nasdaq Composite
down to the 2000 level, if not lower. As you may have noticed by now,
when the herd expects something to happen as a “sure thing,” it
usually does
the opposite.
The anatomy of this upside reversal is
not simple. We didn’t have a “reversal
day” bar on high volume, etc., as most technicians claim is necessary
for a meaningful reversal. Instead, we saw the Nasdaq Composite come
down to test some very old, yet very tried and true support levels.
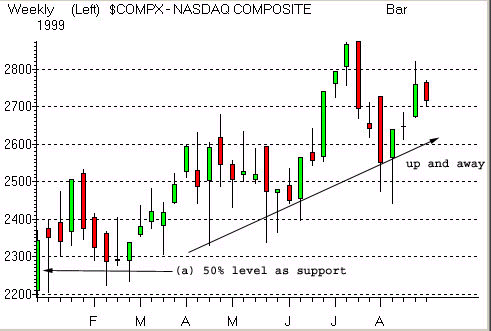
Let’s look at a weekly
chart of the Nasdaq Composite from January of 1999.

As you see from candlestick (a), the
Nasdaq Composite first weekly bar from 1999
saw an open of 2207 and a close of 2344. Let’s disregard the upper and
lower “tails” of
this candlestick and only concentrate on the “real body,”
that is the green part. As
I have mentioned before, the 50% mark of strong green
candlesticks will often serve as support during declines. As we see
in the
several weeks subsequent to (a), the 50% area of this candlestick served
as support during declines
and the Nasdaq ultimately went on to new highs. The
midpoint of this candlestick was roughly 2773. Although
the composite gapped below that level this morning, it immediately
traded higher and exceeded
that level. When the Nasdaq came back and successfully
tested that level late this morning, it was a prudent time to begin
establishing long positions.
In addition, an excellent trader I
exchange thoughts with alerted me that the
2277 level on the Nasdaq
Composite was also the 1.618 Fibonacci extension of the
May 24th, 2000, bottom to the September 01, 2000, high. This was useful
as it began to add
evidence to the importance of the support level displayed by
the Jan. 1999 weekly candlestick. (Thank you, Mr. Noravian!!)
So, as you can see, sometimes key
reversals don’t happen the way we are told to
expect (high volume, hammer formations, doji’s, etc.). Rather, they can
occur by multiple
successful tests of a long-term support level coupled with other
technical confirmation, such as key Fibonacci retracement levels.
Long Watch: Pullbacks
in technology, throw a dart.
Short Watch: Drugs, other defensives
finally have started their death plunge.
Funny how MRK was a “must own” last week at 96.
Random Musings: Much thanks to the
outstanding traders I communicate with during
the day for your teamwork. To the “toros” and “renegades”
traders, you
guys/gals are the best.
