Why I’m Looking At This Indicator
Regular readers of this column know that I like to report on the performance
of
the US junk bond market. Specifically, I like focus on the
spread — difference — between the yields on junk bonds and those of US
Treasuries with similar maturities, as this helps isolate the risk premium that
the market assigns to these issues. The resulting number, or spread, can be used
to gauge the overall state of the economy and therefore corporate health.
The reason is that junk bond investors not only
assume balance sheet risk — as do other corporate bond investors — but, due to
the marginal credit quality of the firms that issue these bonds, these investors
are also very aware of changes in the economy, as the performance of their
holdings is contingent on these macro developments.
Let me give two fairly recent examples of how the junk bonds were accurate in
measuring the true state of the economy.
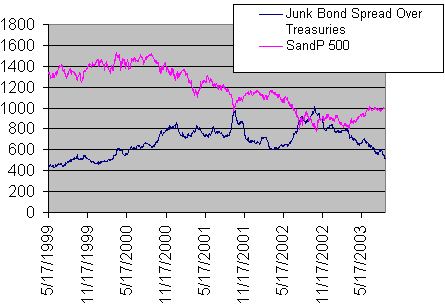
Last October, junk bond spreads hit a multi-year peak, while the stock market
made multi-year lows. Both markets rebounded in the following weeks as investors
became less pessimistic about the future of the economy. That is, until the end
of November, when Resolution 1441 was passed at the UN and the Iraq war became
more of a certainty. Interestingly though, only equity investors became skittish
about their investments. Bond investors were more certain about improving
corporate balance sheets, cash flows and profits. In the ensuing months, a
divergence between the performance of the two asset classes emerged. The S&P 500 pulled back, whereas junk bond spreads narrowed. It was only until
March 11 that the equity markets turned north, and the positive correlation with
high yield bonds resumed.
Similarly, in 2000, when the stock market bubble was reaching new highs, junk
bond spreads were widening, as the highly scrutinizing bond investors became
more pessimistic about the future of the economy and profits. It wasn’t until
September that equity investors caught on and the three year bear market began.

What Are They Doing Now?
As evidenced in the chart above, high yield spreads over Treasuries have been
steadily falling from their highs of 1000 reached last October and are now at
their lowest levels (524) since 1999. And, the current spread is still well
above its historical average of 350 basis points, suggesting that there is still
room to go.
As always, please feel free to email me with your
questions or comments.
