Why I’m Watching These Bonds
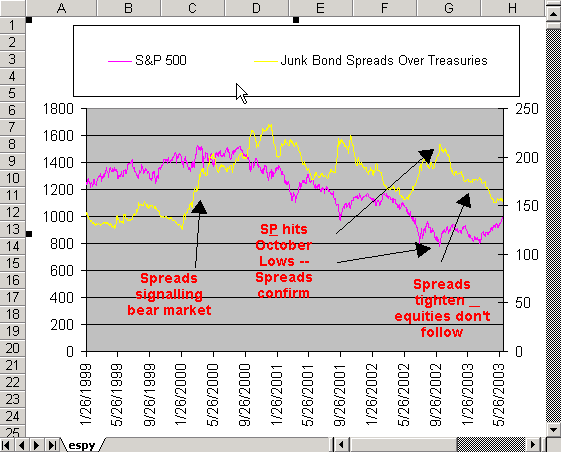
In April, I brought to readers’ attention that there
was a divergence between high yield bond spreads and equity prices,
which are historically well correlated. Specifically, I pointed out that the S&P
(
$SPX.X |
Quote |
Chart |
News |
PowerRating) equities were up a modest 15% from their lows, while bond
spreads had narrowed by 45% since their October highs.
Bond investors were signaling to the rest of the investment world that
corporate balance sheets, cash flows and profitability were brightening.
However, only a select few equity investors paid attention. Corporate bond
investors are highly sensitive to corporate balance sheet risk, as they want to
recoup their money and some. The correlation with equities increases more so
with high yield bonds due to the greater risk/return associated with their
performance.
Just as bond spreads signaled the current equity market, so too did they
predict the three year bear market that began in 2000, as evidenced in the chart
below.
What are they telling us now?
High yield spreads, although off their May lows (remember, lows are a good
thing with bond spreads), are still well in their down-trend, indicating that
the longer term recovery in business conditions is still in tact.
On a short-term basis, readers should be aware that the latest Bull/Bear
ratio from Investor Intelligence currently stands at 3.6, which is the highest
showing since April 3 1987, and could very well be indicating that a short-term
correction, or consolidation, is in order. The reason is that Bull/Bear ratios
are often a good contrarian indicators when extreme readings are registered.

Â
