Why More And More Traders Are Trading The QQQs, Part III
In the
beginning of our look into the Nasdaq 100 Tracking Stock
(
QQQ |
Quote |
Chart |
News |
PowerRating),
Part
1 led us into what the Qs are, and why we should incorporate them into our
trading. In Part
II we examined basic strategies for trading this instrument. In this final
installment of our series, we will take a more advanced look at some of the
methods TradingMarkets.com contributors Kevin
Haggerty, Carolyn
Lueck, and the guru of the Qs, Don
Miller, employ in their own trading, using this versatile issue.
Kevin Haggerty
Here is a trading
strategy that Kevin Haggerty uses in the QQQs by following the action of the
Nasdaq 100 index.
Prices often pull back
or “retrace” a
portion of their previous trend before resuming that trend. Retracements are a
fairly simple concept. You measure a trend from a significant low to a
significant high and take percentages of that move for likely support and/or
reversal levels. It’s likened to the phrase “two steps forward and one step
back.†If a market did exactly this, then it would be a 50%
retracement. The most commonly used
retracement levels are 38.2%, 50% and 61.8%.
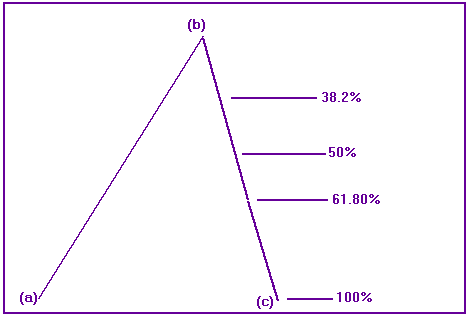
Referring to Figure 1, notice that the retracement levels for the move
from (a) to (b) are
shown on the right side of the chart. Obviously, if the market comes all the way
back to (c) then 100% of the prior move has been
retraced.
Using the daily chart of the Nasdaq
100 index
(
NDX |
Quote |
Chart |
News |
PowerRating), Kevin notes that the price action has the index rallying
off the January low of 2087 to the high in the same month of 2772. After that,
the index proceeds to retrace a portion of that move and return back towards the
.618 Fibonacci retracement of that move higher.

Now
that Kevin has gotten the bigger picture from the daily chart, on the morning of
Feb. 7 he is scrolling his intraday chart of the Nasdaq 100 Tracking Stock
(
QQQ |
Quote |
Chart |
News |
PowerRating)
for an entry point. The Nasdaq 100 Index is not a tradable instrument, so to
trade its action one must utilize either the QQQs or the Nasdaq 100 futures
contract. Sure enough, on the five-minute chart, the index sells off and comes
down to kiss this .618 retracement.

Kevin
is now executing his trade in the QQQs after the stock makes a 1-2-3 bottoming
pattern, where the issue creates three swing points. The first swingpoint is the
move down to the .618 retracement (1), number two is the move higher (2),
and the last swing occurs at (3).

The
stock trades up more than 1 point from the entry before Kevin’s trailing stop is
hit, resulting in a profitable trade.
Carolyn Lueck
In this example,
Carolyn Lueck shows me how she switches gears, shorting the Qs and then turning
around and going long.
Carolyn:
“Initially
I was short in a trade, based upon resistance at the area where the Nasdaq
failed back in early March.
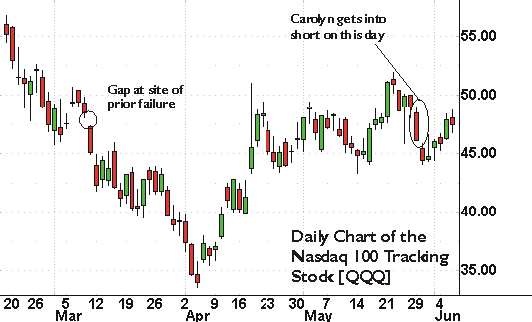
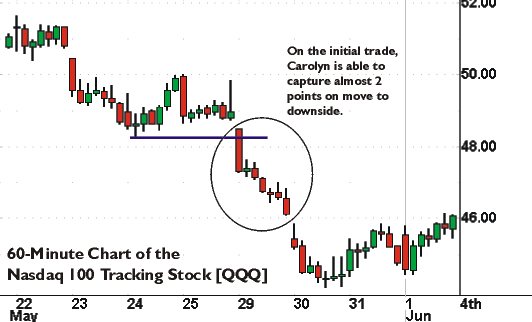
“So I got a nice
trade on a pretty large short position in the Qs that I covered on May 29. I
then switched gears and took a long position in the afternoon the following day.
If you look at the 60-minute chart back on May 15 to 16, you will see a small
gap down on the open of the 16th, and the low in the 44 area, just before the
index started to break out to the upside. On the afternoon of the 30th, for
about three and a half hours it kept trying to push down below that lower 44
area, and we stabilized there. Things started to move up and my MACD started to
give a buy signal, so I got into my long position late in the afternoon at
44.25.
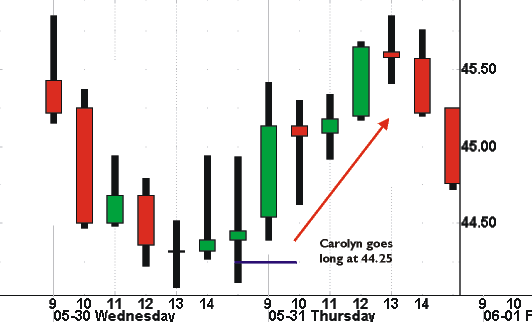
“I held it through
the open, and I was looking to get out at a target somewhere between 46 and 47,
and just make a quick day trade. My thinking at the time of the trade was that
the sentiment in the market has changed pretty dramatically from the euphoria of
just last week and it changed rather quickly, which makes me very nervous. I was
looking for a pullback, I was definitely looking for a buyable entry in the
market, and I think I got that on the 31st. But I just didn’t see it carrying it
as high as it may have last week with the euphoria, because everything has kind
of ground to a halt here. I think all the bad news, that has always been here,
is finally being understood a little more. I exited at 45.45, short of my
original projected target, when the market weakened later in the trading
session.”
Don
Miller
Don Miller was kind
enough to walk me through a contra-trend trade, taking advantage of a brief
pullback in an intraday downtrend to make a nice profit on the long side.
Don:
“Basically, the main way I trade is to use the 5- and 15-period moving
average for support and resistance points in the QQQs on multiple time
frames. I am always watching those MAs on a 1-minute, 3-minute and 13-minute
basis. One of the things that I look for are oscillations or reversals in
trends. Three out of the last four days, we sold off hard, and at some point,
you come to a point in the trend where probability is starting to shift more
toward a bounce. Trends do not just go on forever, and we are aware of that. So,
one of the things I was doing this morning, as I was also doing late yesterday,
was looking for any sign, that we would bounce. Yesterday’s decline came on
still relatively modest volume, and so I felt that at some point the probability
was there to cause a turn. Even though I often use a 1-minute chart, I have
actually shifted a little bit, due to the extent of the decline, to a 3-minute
chart. The trend has been, so, so strong. We have been selling down on 13-minute
charts, 30-minute charts, you name it. And so a 3-minute turn is actually a
pretty early entry, and yet I feel that someone can still profit from it.
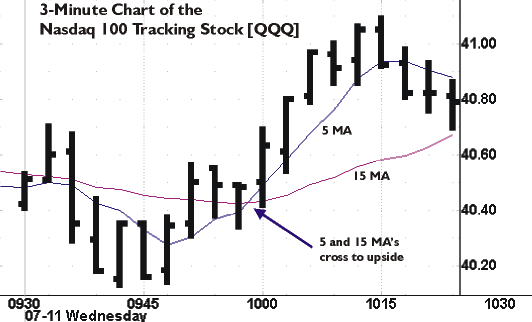
“So moving along, this morning
continued to sell down further, and I was basically looking for one thing. I was
looking for a stabilization on the 3-minute trend. For me, stabilization is
defined when the 5-period MA crosses the 15-period MA in the direction of the
trade, or in the direction I am looking for. And indeed that did happen this
morning, right at about 9:55 a.m. we did get a cross, so to me that signaled
somewhat of an ‘all clear’ for the moment and I took that as an entry.
“Now, I recognized
that, longer-term, we are still in a downtrend, so this is trading a mini trend
in the context of a larger contra-trend. So what I was using as my exit point,
and scaling out of the trade as it is approaching that exit point, was the
15-period MA on the 13-minute chart, since it is clearly still in a downtrend.
The 15-period MA on that chart was showing support for that existing trend, or
resistance on my long trade.
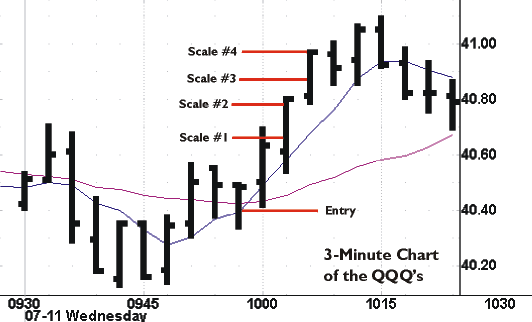
“I like to get in
early, so what I did is, as the QQQs were climbing, being very, very conscious
of the longer-term downtrend made sure that I got out of the trade as it was
approaching that natural resistance point. In this case, I got filled at my
entry at 40.40, and I just scaled out as it climbed. I scaled out first at
40.64, then at 40.80, then 40.86 and finally sold my last piece of the position
at 40.98. This type of exit is very typical of how I trade.
“Some people, like
Alexander Elder for example, will say that you should make sure all your time
periods are moving in the same direction. I say, well, not necessarily, as long
as you recognize that you are trading a mini trend, if you want to call it that,
that is just a retracement of a larger-term trend heading the other way. Over
the years a good number of my trades reflect that sort of strategy, and yes, it
does require focus and knowing when you need to be out. So that is what happened
in this trade, and boy, I caught almost .60 on the QQQs, with very good share
size. I was waiting for it, and it showed up.
“I know that a lot
of people will not do this. They feel ‘you have got to trade with the larger
trend.’ The truth is, either way you can get into trouble unless your entries
are well timed. You can trade with the trend late and get killed just as easily
as trading against the trend. At some point the trend just gets so over extended
that, at a minimum, you are going to flatten out and oscillate a little bit.
That’s what happened here.”
Breakouts Over A
Triple Top
Price action which often will signal
the beginning of a very powerful move is a triple top. Whatever the time frame,
daily, hourly or on the five-minute bars — you don’t often see a quadruple top.
Two things can occur at this juncture, you will get a breakdown and fail if it
cannot overcome the resistance level, or the stock will rally and take out the
triple top. The tops do not have to be horizontal either. This technique works
equally well on an angular basis, as it did in this example from Tuesday, July
17.
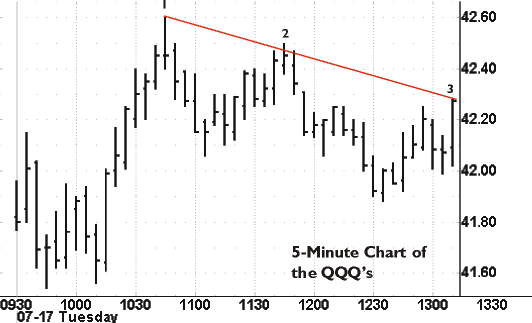
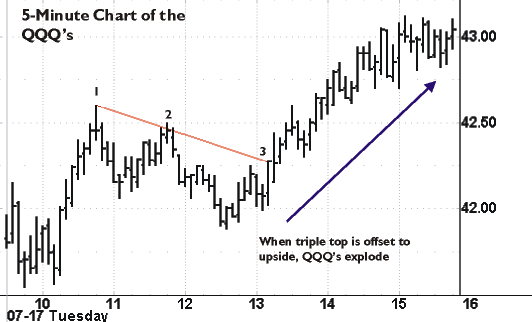
Here the Qs have been in
a two-and-a-half hour downtrend with three lower swing highs, and things are
beginning to look like gloom and doom is descending. However, when the triple
top is offset to the upside, look out.
In closing, these are
some of the myriad of methods and strategies that market warriors carry into
battle every day in this arena. Experiment on paper and see if you are on the
right track, making use of the techniques that have been profiled here. In
addition, make sure you read Don
Miller’s commentary every day, to get a better feel for the movement of the
Qs on an intraday timeframe.
Thanks for joining me in
this series.
For The Best Trading
Books, Video Courses and Software To Improve Your Trading
