A Day In The Life Of A NYSE Trader
I
guess you could probably call me a technical trader.
I analyze patterns nightly, prepare a game plan for the next day, and
then wait impatiently for my setups to
trigger. I have spent the past five years
or so working almost exclusively with NYSE issues, primarily because I feel that
the follow through on my nightly analysis is much smoother than when applied to
Nasdaq trades.
This has made me something of a loner in the trading community, but I have
managed to stay profitable in some pretty tough times, and that is the name of
the game as far as I am concerned. Have I
missed something by avoiding the Nasdaq in the midst of two major trends?Â
Probably. Have I made a consistent
living doing something I love without experiencing a significant drawdown? Beazer Homes
(
BZH |
Quote |
Chart |
News |
PowerRating)
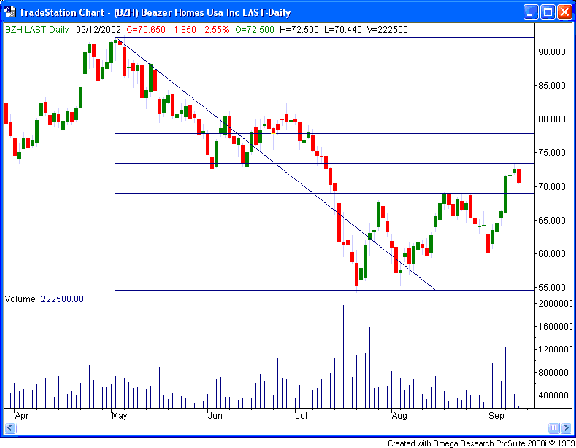
could move as low as 69.88 today. Price
is mean-reverting, and BZH was trading two standard deviations from its recent
mean price. This, coupled with a 50%
retracement of its May to August move, suggested to me that a trade was setting
up.

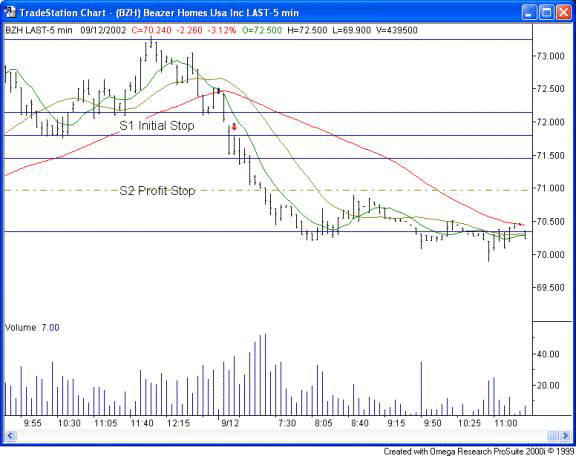
This morning’s negative economic data set the stage for profit.
BZH opened and immediately began selling off.
The NYSE specialist filled orders at the bid for the first 15 minutes of
trading, and then, at 9:45, a slight pullback opportunity with good resistance
presented itself, allowing us to short the stock at 71.53.
The initial stop on this trade was a tight 71.80, which would represent a
successful penetration the first support pivot as established by yesterday’s
price action, as well as the 50% Fibonacci retracement of a significant recent
intraday move.Â
The profit stop once the trade began moving was set at 70.98,
representing resistance offered at the second pivot based on yesterday’s price
action.

For those of you
unfamiliar with pivot lines, the following is a brief explanation.
I find these price points very useful for determining intraday support
and resistance levels of volatile equities. Today’s
Pivots are a function of yesterday’s high, low, and close for a specific
security or contract.
H = Yesterday’s
High
L = Yesterday’s Low
C = Yesterday’s Close
The equations for
the Pivot Lines are
Pivot              Â
=Â Â Â Â Â Â Â Â Â
(H+L+C)/3
Resistance 1Â Â Â Â =Â Â Â Â Â Â Â Â Â
2*P-L
Support 1Â Â Â Â Â Â Â Â
=Â Â Â Â Â Â Â Â Â
2*P-H
Resistance 2Â Â Â Â =Â Â Â Â Â Â Â Â Â
P + (R1 — S1)
Support 2Â Â Â Â Â Â Â Â
=Â Â Â Â Â Â Â Â Â
P — (R1 — S1)
I generally spend
most of the trading day nursing one or two open positions.
Given my personal psychology, this works well for me.
I feel that the key in this business is understanding yourself, and then
worrying about understanding the market. I
get a lot of questions from aspiring traders who want to know what the
“secret†of profitability is. My
response is always the same. There is
price action available to suit just about anyone.
Your job begins and ends with determining what environment will foster a
comfort level that leaves you confident enough to pull the trigger and make a
living.
Good Trading!
Dr. Adrian F. Manz
Â
