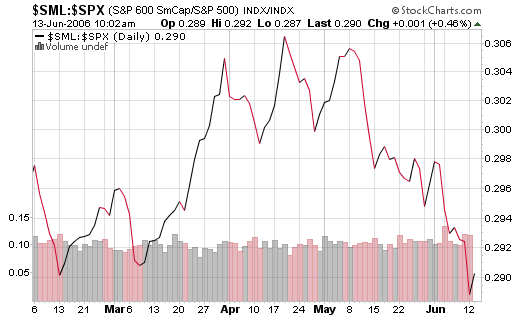
A Hideout During Market Turmoil
Small caps have exploded on a relative strength basis all the way back since
2000. Back in 2000 small caps were undervalued and had not fully participated in
the great bull market that took high-tech big caps into the stratosphere. In
fact small caps didn’t endure a very substantial bear market compared to the
Nasdaq. Instead of peaking in 2000, the SML small cap index went into a
prolonged trading range between around 240 and 180 and then made new highs into
2002 at 260 before falling into the lows late 2002 around 170. Then
outperformance accelerated briskly.
The outperformance of small caps came from a high degree of undervaluation but
has taken them to a historically resistant high degree of overvaluation
currently. The spread between small caps and large caps also has approached the
level of the major peak in relative strength last seen in the early 1980’s on
this move. Small caps tend to runaway in terms of relative strength until either
RISK AVERSION tends to grow or until monetary policy tightens and real fed funds
rate approaches GDP growth. We have arguably all of the negative ingredients
that have historically led to small cap underperformance going into mid 2006.
The real Fed Funds rate (Fed Funds minus CORE inflation) is getting close to GDP
levels; meaning policy is no longer stimulative. Junk bond spreads and the RS of
risky assets clearly mark a new trend toward risk aversion now. The RS of
small/large caps has reached historical resistance. And finally the spread
between small and large caps has traced out a Head & Shoulders topping pattern.
Note on the weekly chart of this spread that a significant uptrend line support
is being tested now.

We believe the spread of small caps over large caps is peaking on a secular
basis potentially here or soon and that this represents a reasonable hideout
with some capital for investors while market turmoil roils. The position could
be added to on a CLEAR breakdown of the uptrend line basis the weekly chart. The
spread tends to increase at a double-digit annual rate once policy becomes
restrictive and usually lasts until policy becomes stimulative again. In this
environment, and barring further technical confirmation of this trend, this may
be one of a number of fairly low risk but reasonable return potential hideouts
for investors. We prefer being short growth and long value as well — and
investors have lots of options as to how to put on this trade using iShares such
as long IWD and short IJT.

