A long-term look at the markets you should be watching
Market
View:
The past
month’s financial market action has been all over the map, and nowhere
directional to speak of. Join me for a trip thru the monthly trend charts and I
think we’ll see some very interesting things developing in the coming months &
years ahead.
S&P
500
S&P 500
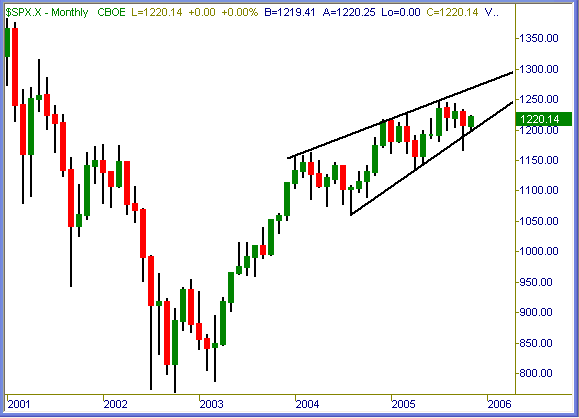
has traded inside consecutive monthly candles on a closing basis since July.
August thru October candles closed inside the green candle of July (fifth to the
left from end) in consolidation fashion. Now, October was one heckuva rocky
month but in the end it resolved absolutely nothing on a trend basis.
We also
see where price action has been flagging higher since the start of 2004. This
two-year long pattern remains bullish until proven otherwise. In order to prove
otherwise, a monthly candle must close below trendline of support currently near
that venerable 1200 level.

SOX
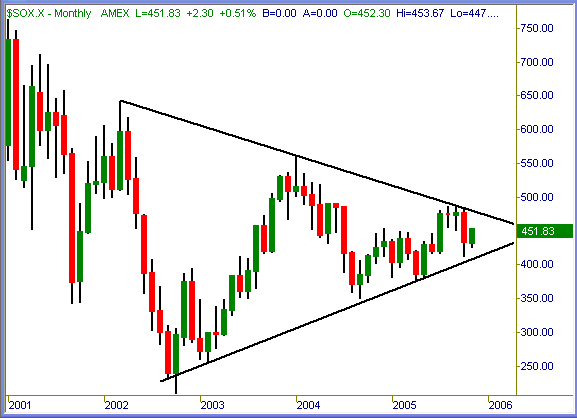
SOX has
spent the past three years winding itself into an ever-shrinking wedge, may we
add in perfectly symmetrical fashion. When this one finally breaks upside or
down, momentum should carry it to significant directional heights or depths from
there.

EUR/USD
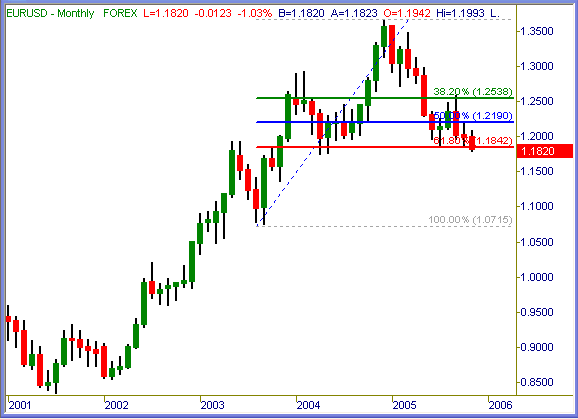
Eurodollars tested and held this 62% level support two times since August. The
third drop into this level on Friday threatens to break below, but a lot of
month is left in this chart. Early 2004 lows are next potential support ahead,
and a closing candle below 1840 would be very bearish for EUR indeed.

GBP/USD
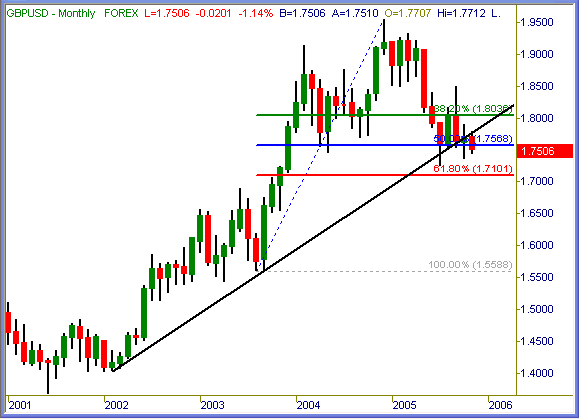
British
Pound honored an ascending trendline dating back to early 2002. Price action
rose +5500 pips or +$55,000 per FX contract since then, quite a buy & hold
return for anyone who had great fortune to do so.
For the
rest of us here back on planet Earth, a candle close below said trendline this
month would confirm continued downside bias for the GBP in harmony with pending
EUR weakness profiled earlier.

Summation
Stock index markets still hold a bullish trend bias until otherwise
confirmed in the monthly long-term charts. Recent heightened volatility and
extreme sideways swings did nothing more than shale out weak hands from grossly
overbought stock sectors and indexes. Once the churn completed its roll, stock
index markets appear to be headed sideways or higher towards year-end. Breakdown
confirmations in the clear support levels on equity charts above would be first
signs of bearish trend moves ahead.
Currency
markets are all heavily weighted toward the U.S. Dollar against foreign symbols
across the board. For whatever fundamental reason(s), the greenback is kicking
backside in cross-pair exchanges on their big trend charts. What we see always
trumps what anyone believes when it comes to financial market action, and right
now currency markets are heading in defined trend directions in favor of the
U.S.D.
Other
stock index/sector and FX currency pairs charted in our weekly trend view
section support similar bias views for the “big four” symbols profiled above.
Hope this
overview helps, and good trading to you this week as always!
Trade
To Win
Austin P
(Weekend Outlook trend-view section…
open access)
Austin Passamonte is a full-time
professional trader who specializes in E-mini stock index futures, equity
options and commodity markets.
Mr. Passamonte’s trading approach uses proprietary chart patterns found on an
intraday basis. Austin trades privately in the Finger Lakes region of New York.
