A number of critical areas
One of the things we have always
sought to recommend the value of is in watching market action carefully and
learning to read the signs left by market action when there is a plurality of
signals from different markets and sectors. In
the current environment a number of different markets appear to be getting close
to some fairly important levels and important action off of those levels that I
think bear commenting on.
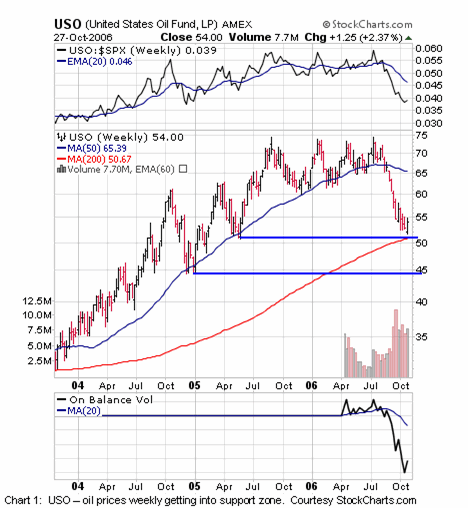
Oil and gold are both bouncing off of significant support
levels. Oil has hit the roughly 44-51 weekly support zone that was also the
target of the trading range consolidation breakdown of this summer. OPEC is
starting to strive to support prices around here as well.
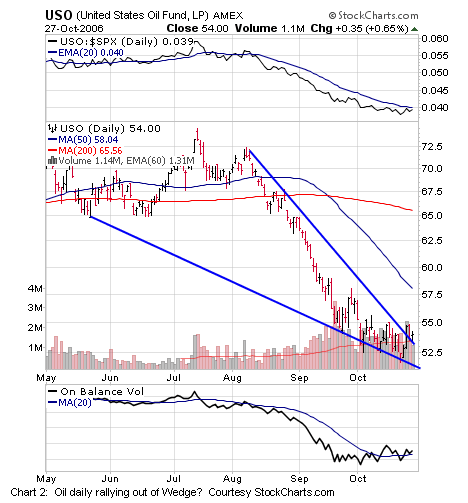
Chart
2 below shows
(
USO |
Quote |
Chart |
News |
PowerRating) on a daily basis having broken out of a wedge formation this
week to the upside. A move over the 55-56 level next week will confirm at least
a bear rally of shorts likely to continue in Crude Oil. Sentiment also got a
bit over bearish in oil during this decline, adding a bit of credibility to a
potential short-term rally at least.
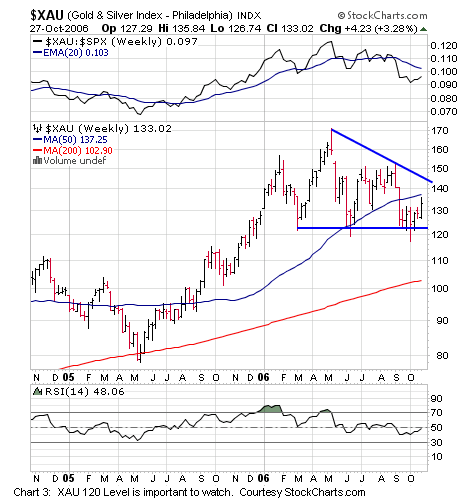
Interestingly, at the same time oil has been hitting a support level and
starting to some signs of at least a technical bounce, gold stocks and gold have
also been hitting significant support. Chart 3 shows that the
(
XAU |
Quote |
Chart |
News |
PowerRating) 120 level has
proven significant support to gold stocks all year. A slight bounce off of this
support level has developed so far. It will be important whether this level can
hold price declines or if it gives way clearly on subsequent declines for the
outlook for gold and gold stocks. A weak and high volume close by XAU below
118-120 accompanied by a weak and high volume close by
(
GLD |
Quote |
Chart |
News |
PowerRating) under 55 would
suggest a further leg down in the precious metals. Conversely, the longer these
levels hold, and the stronger the price action off of them, the more likely that
at least an intermediate low is at hand. Let the market tell its tale.
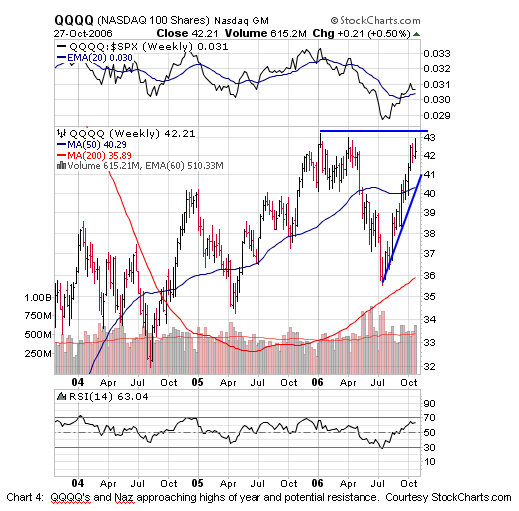
The NASDAQ and
(
QQQQ |
Quote |
Chart |
News |
PowerRating) are also approaching the year’s highs, a
natural level of resistance at the same time some smaller cap indexes are doing
the same. A strong and high volume move by the QQQQ’s over 43.5 or so would be
a good indication that this market can run further. Conversely a close below
the steep up trend lines in QQQQ’s (shown in chart 4) as well as a break of the
steep up trend lines in the Naz and Russell small cap index would likely signal
the first real correction of the up leg since July was underway.
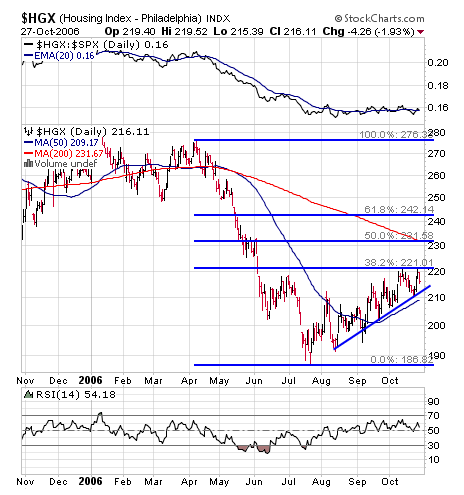
One
of the weakest and most critical sectors of the year has been housing. We’ve
mentioned the steep decline in the NAHB housing index and the likely
underperformance of housing stocks for some time. However housing stocks are at
some critical levels and decision points as well. Chart 5 shows the
(
HGX |
Quote |
Chart |
News |
PowerRating) having
just hit 38% retracement levels and bounced down a bit. This month the NAHB
index actually moved up from 30 to 31. In 1990 and 1994 when this index turned
up, housing stocks turned up and moved up sharply in the ensuing years. Does
this NAHB index up tick from recession levels indicate that housing stocks will
bottom in anticipation of a stabilization of housing down the road a ways, or is
this housing decline more significant and long lasting than those of earlier
periods? The HGX action can help us tell. A weak close on strong volume below
the up trend line shown on chart 5 after only a 38% retracement of the decline
since April would start to argue for more housing stock weakness than is normal
in a typical cycle. Conversely, a strong and high volume close above the 222
level AND above the 200 day ma by the HGX would be a first indication that
housing stocks may indeed be bottoming along the lines of a typical down cycle.
And a weaker housing group would argue for more economic weakness to come,
whereas an HGX able to rally significantly would argue for an economy that is
stabilizing at current growth rates.
We
still suggest less than aggressive allocation to global equities and would look
to add or accumulate
(
TLT |
Quote |
Chart |
News |
PowerRating) on this correction as we expect that the slowdown is
not over and that the Fed will not letup on a tightening bias until the slowdown
develops more clearly so that inflation does not reappear and get entrenched.
We like some pairs, and some select big-cap dominated groups along with the
small number of stocks meeting our criteria for below normal allocation to
stocks.
Since
a number of markets are reaching important levels, let’s sit back and watch how
the market behavior in some of these key groups will suggest markets should move
in the period ahead.
Lots of
bonds as well as light big-cap exposure still seems prudent to us here until the
environment becomes clearer. Long/short pairs and some big-cap exposure to some
favorite groups and the stocks that do meet our criteria are suggested. Let’s
watch market action in critical areas closely in the period ahead for clues.
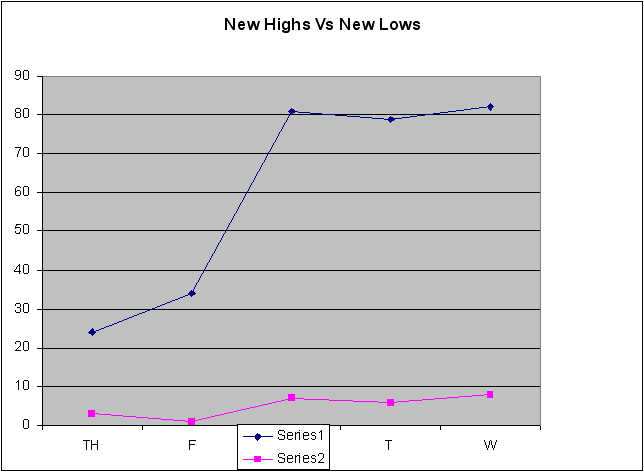
Our US selection methods, our Top RS/EPS New Highs list published on TradingMarkets.com,
had readings of 24, 34, 81, 79 and 82 with 21 breakouts of 4+ week ranges, no
valid trades meeting criteria , and no close calls. This week, our bottom
RS/EPS New Lows recorded readings of 3, 1, 7, 6 and 8 with 1 breakdowns of 4+
week ranges, no valid trades and no close calls.
(
TWGP |
Quote |
Chart |
News |
PowerRating) and
(
SPI |
Quote |
Chart |
News |
PowerRating) remain open
trades on the long side from this methodology.
Mark Boucher has been ranked #1 by Nelson’s World’s Best Money Managers for
his 5-year compounded annual rate of return of 26.6%.
For those not familiar with our long/short strategies, we suggest you review my
book "The Hedge Fund Edge", my course “The
Science of Trading“, my video seminar, where I discuss many new techniques,
and my latest educational product, the
interactive training module. Basically, we have rigorous criteria for
potential long stocks that we call “up-fuel”, as well as rigorous criteria for
potential short stocks that we call “down-fuel". His website is
www.midasresourcegroup.com.