A Quantitative Approach for Trading Calendar Spreads
In the handy dandy options traders’ tool belt of trades, one of the most versatile and widely used strategies is known as the calendar, horizontal or time spread. The name refers to options being purchased and sold as a package in different expiration months. A long calendar for example means buying an option with a longer expiration and simultaneously selling an option at the same strike with a shorter expiration. Typically in stocks and indexes the trade is placed for a debit, as farther out options normally trade for higher prices than the closer in options. The trade can be placed using either calls or puts. Call calendars are identical to put calendars when using the same strike.
The calendar spread is ideally placed in a market environment where the underlying price movement is expected to be minimal and where overall implied volatilities are stable to rising. This allows the price difference between our long and short options to expand, causing the price of our debit spread to rise. Should the market move significantly in either direction however, the most that can be lost is the amount paid, or debit amount, for the spread.
Click here to order your copy of The VXX Trend Following Strategy today and be one of the very first traders to utilize these unique strategies. This guidebook will make you a better, more powerful trader.
The calendar spread itself tries to capitalize on the differences in time decay of options between months. This characteristic of time decay, or theta, can be shown graphically from the following chart in Figure 1.
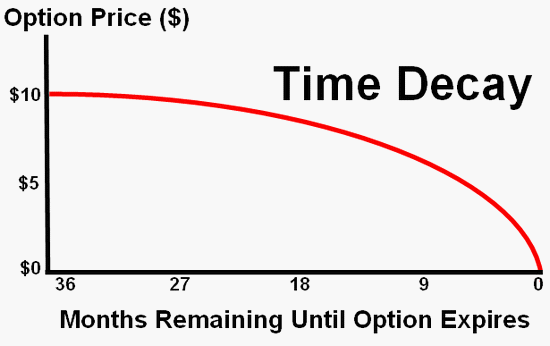
Figure 1 Option Time Decay Accelerates
As is illustrated by the chart, time decay of options accelerates as we get closer to expiration. Therefore our short nearer term option will decay faster than our long farther out option. The differential in decay between the two options should produce a positive overall theta.
As we stated, the calendar performs best when the market is range bound. However, besides movement in the underlying, the other significant factor that affects the profitability of the calendar, like all options, is implied volatility. In the long calendar we are long farther out options and short front month options and the position is long vega. Therefore, as implied volatility moves up, our spread makes money and as volatilities fall, we lose money, all else being equal. But the vega value at the bottom of the matrix is more of a global read, assuming uniform movement in changes in volatility across both months. In reality volatility often moves differently in different months based on a variety of factors such as earnings or other event risk, movement in underlying and volatility skews. For example, in “normal” market environments the farther out options have a higher implied volatility than the front month options. This relationship is known as negative skew. However, when markets experience turmoil or in the case of individual stocks earnings announcements, the front month volatilities can move higher than that of the back months. This is known as positive skew. During times of market upheaval investors and traders look to buy options with the greatest “protection per dollar spent”. That normally means the front month options where they are the cheapest on a dollar basis and provide the greatest amount of gamma.
Not only do overall movements in volatility affect performance but so do relative changes between the months and strikes. These changes of volatility between strikes and months simply reflect the changing pricing of the options based on supply and demand in the market. And those changing prices not only affect our current profit and loss but also can affect the future performance of the trade. Simply put, it’s easier to profit on a calendar that cost $3 than one that cost $4.
2008 was wild year not only for stock prices but also for volatilities on options. The vix ranged from a low in May of around 17 to an intraday high of 96 in October. This unprecedented “volatility of volatility” presented many challenges to positions like the calendar. First, all option modeling software is presented with complexities when an input such as implied volatility changes so dramatically. The predictability of models is dependent on the consistency and reliability of the inputs used. When volatilities and to a lesser extent, interest rates, changed so often and by such large amounts in 2008, the model had a hard time in coming up with a reliable model of how the trade would perform over time.
That said, by December of 2008 I think everyone trading income collecting strategies including calendars were hoping for a sleepy monthly trading cycle. So let’s look at how a calendar in SPY performed to close out 2008. On Friday, December 12, 2008 the following trade is placed. VIX is around 55.
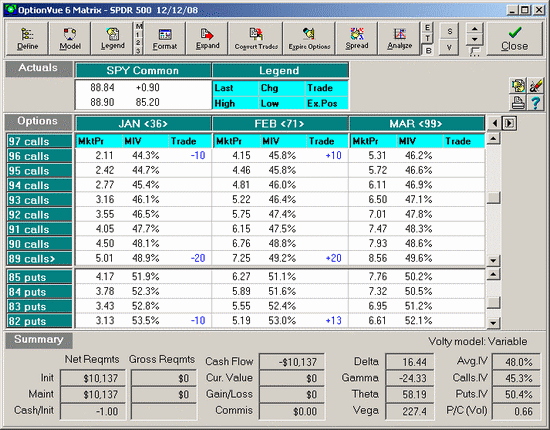
Figure 2 12/12/08 Initial Circus Calendar Spread
We bought 3 extra February 82 puts to flatten out our overall delta. Note also the average IV is 48.0%.
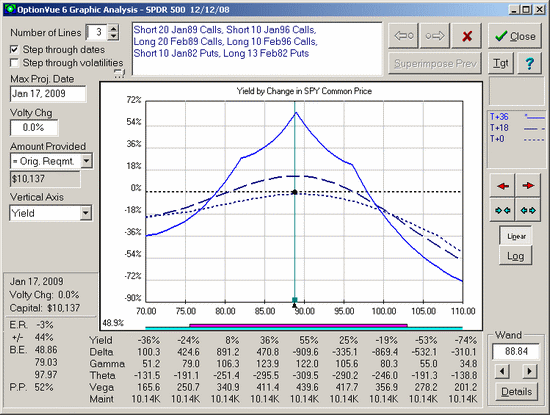
Figure 3: Graphic Analysis of Initial Circus Calendar Position
As the month progresses the market stays nicely in a fairly tight range. The SPY closes on December 22 at 87.06. However, volatilities have dropped significantly. Average IV for our trade is 40.9%. VIX is now 44. Our P/L is showing the negative effect of the drop in volatilities on our long vega. We are down nearly 16% or $1602. With average IV’s down about 7 points from when the trade was put on and an initial vega of 227, we see that the loss can be attributed to our vega exposure.
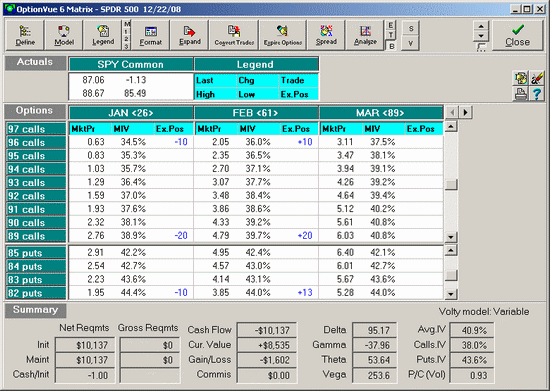
Figure 4: 12/22/08 Matrix shows losses that occur due to declining implied volatility levels
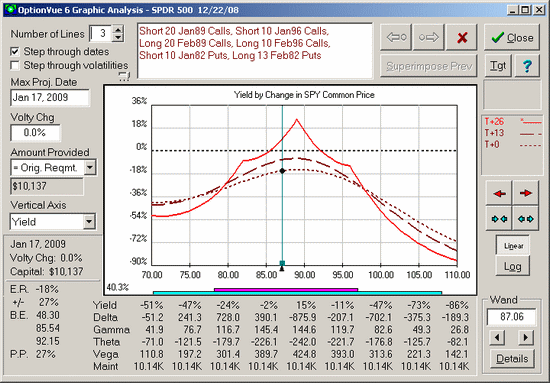
Figure 5: Declining IV has resulted in the Circus Tent sinking straight down
As we can see, this negative volatility effect sinks the entire calendar profitability graph. Under current inputs, any significant movement up or down will now result in a loss on the overall position. The loss incurred by the drop in volatility combined with any potential movement away from the most profitable 89 strike will be more than the position can overcome. The best we can hope for here is the market stays close to the center 89 strike.
And stay close the 89 strike it did. Below is the matrix on January 9, 2009.
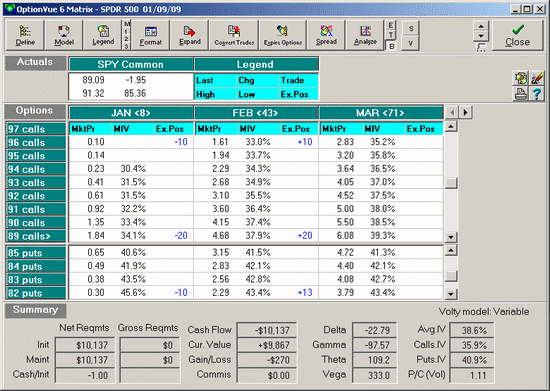
Figure 6: 1/9/2009 Matrix shows a position recovery
As we can see, we could not have placed the market much better than where it closed. However, if we stayed in the trade for the entire month we still had a loss of nearly $700 or about 7%. Even with a market that performed perfectly from a movement standpoint, we could not overcome the negative effect of volatilities that moved down so dramatically. Average IV’s ended at 38.6%, over 9 points below where they were when we started. The VIX, the widely watched volatility barometer, was below 43. We did manage to collect nearly the maximum amount of theta on the trade which helped to minimize our overall loss. The analysis graph can be seen below.
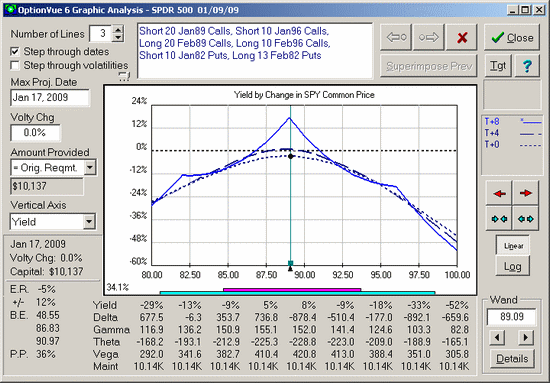
Figure 7 — Screen shot of analysis graph
Now that we know we can lose money trading calendars even when the underlying performs perfectly, can we use that information to help us in our overall trading? The most important determinants of successful options trading are movement in the underlying, as measured by delta and gamma, and changes in volatility, the risk of which is measured by vega. By careful leg placement and exit management of our trades, we can manage to some extent the delta and gamma risk. Management of the vega risk is best done at the portfolio level.
What this means is that by having some trades that are long vega and some that are short vega and hence keeping our net vega exposure close to flat overall, we can limit the effect of changes in volatility on the overall portfolio of trades. This strategy makes sense in all market environments but worked especially well last year. With volatilities changing so much and by such large amounts, an overall close to flat vega position mitigated much of the vega concerns at the portfolio level, i.e., some strategies will benefit and others will suffer on volatility moves, but net-net they will balance out. In fact, this is the same idea I used when managing risk for myself and other floor traders.
Steve Papale is a trader and mentor with DiscoverOptions, an educational division of OptionVue, creator of the award winning OptionVue software. Steve has more than 20 years experience as an economist, market maker and risk manager and trader. From 1987 to 1999 he was a market maker at the CBOE and CME trading stock index, currency and individual stock options. Steve was also an off-the-floor market maker in the S&P 500 e-mini options and Eurodollar (EOS) options and managed one hundred traders at a proprietary trading firm. He also educated individuals, advisors and institutions on how to effectively implement options as a portfolio management tool. He is currently mentoring clients along with trading his own account. He has an M.A. in Economics from Michigan State University and holds NASD Series 3, 7, 63, and 66 securities licenses.
Backtested on over 17,000 trades test this new trading indicator for Leveraged ETFs and find high probability setups daily – click here now.
