A Simple System for Swing Trading Dow E-minis
Swing trading the DJIA index has been very difficult for many traders lately. There doesn’t seem to be a clear trend and the intraday swings have been tremendous, shaking out all but the hardiest traders. I have created a simple system to handle these exact conditions the Dow is experiencing now. This article will lay out the basics, but first let’s take a look at the technical picture of the DJIA, itself, in more details.
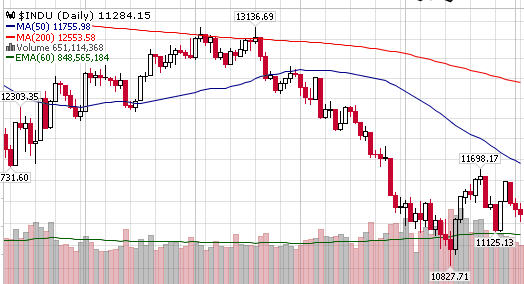
As you can see the DJIA hit a low of 10827 in mid-July, rebounded nicely to 11698.17, before falling again to 11125.13. Price then climbed again, forming what looks like a double top, prior to dropping again over the last 3 trading days. Multiple mixed economic messages are the root cause of this volatility. On the most basic level, oil is dropping fast which is a huge positive, but extreme uncertainty in the financial/credit sector is pulling the entire economy down.   Most traders, including myself, hold a highly bearish bias right now.
Technically and fundamentally, it looks like there are many further and steeper declines on the way. However, it is very important for the trader to maintain an agnostic view of the market until direction appears clear. Remember, the market will surprise even the most sophisticated trader, so patience is the real key in trading the DJIA index.
I use the Dow E-mini for swing trading the system. Its symbol is YM and it trades in $5.00 increments or ticks. It tracks the cash DJIA closely, has great liquidity and ease of access for most traders.Â
I call this basic system “The Channel System”. It’s one way a trader can put a semblance of order to the recent chaos in the market. Here are the basic rules: I use a 15 minute YM chart for setting up the parameters and trade from a 3 minute chart. There are no indicators or other technical tools used. Take a 15 minute chart over the last 3 trading days. Draw a horizontal line 3 points above the high of this period, and another 3 points below the low of this period. This creates a horizontal channel on your chart. Right now the upper line is at 11373 and the lower line is at 11197.

I call this channel the “death channel”. No trades are made if price is within this channel. The next step is to move the channel to your actual 3 minute trading chart. The levels remain the same, just the timing of the bars/candles differ on your actual trading chart. There are several variations on how this channel can be traded, but on the most basic level, it’s a break out system. When a full three minute bar forms above the upper line, this is a go long signal. When a full three minute bar forms below the lower line, it’s a trigger to go short. The rules dictate that once entry is made, the initial stop is if price drops back into the channel. However, once profits are achieved the exit becomes discretionary depending on your personal goals for the trade.
Some traders use trailing stops, other simply let it ride, attempting to catch the big waves. This letting it ride will catch the big moves, but you will at many times give up most or all of your profits during the times the market doesn’t trend in one direction.
I don’t have a time frame on how long I stay in with this system. I like to stay in as long as possible, so when the system catches a big move, several times a year, it makes up for the churn the rest of the time. This system is not for everyone, and can be tweaked by the trader to better fit their goals. However, I have found it to be quite effective at putting order in the chaos.
Best Wishes
David Goodboy is Vice President of Marketing for a New York City based multi-strategy fund.