A Simple Way to Use Price and Volume in Day Trading
In continuation of the series of articles dedicated to the practical aspects of Day Trading, I would like to add a couple more hints into our Trading Toolbox. These ones are also related to trading Volume and can provide you with the valuable information about the situation at a particular stock and about the entry signal.
Here we will learn how to recognize a power that stands behind a particular pattern that you can see on stock chart. It is either a big Buyer or Seller hidden behind this pattern. By knowing what is happening, you can easily select a direction you want to be in, either Long or Short position. So, let’s look at some pictures again.
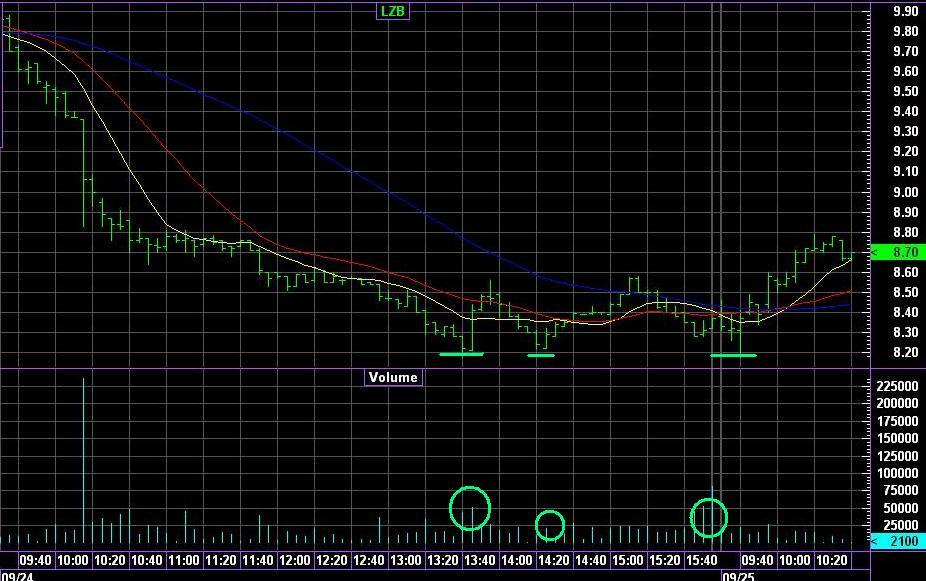
On the Picture 1 below you can clearly see that the stock is not going lower than $8.20 level. Many of traders will call it a Support level and it will be correct, but what really stands behind is a big Buyer, who buys this stock every time it gets back to this $8.20 level. You can also notice some increase in Volume every time the stock price touches this level.
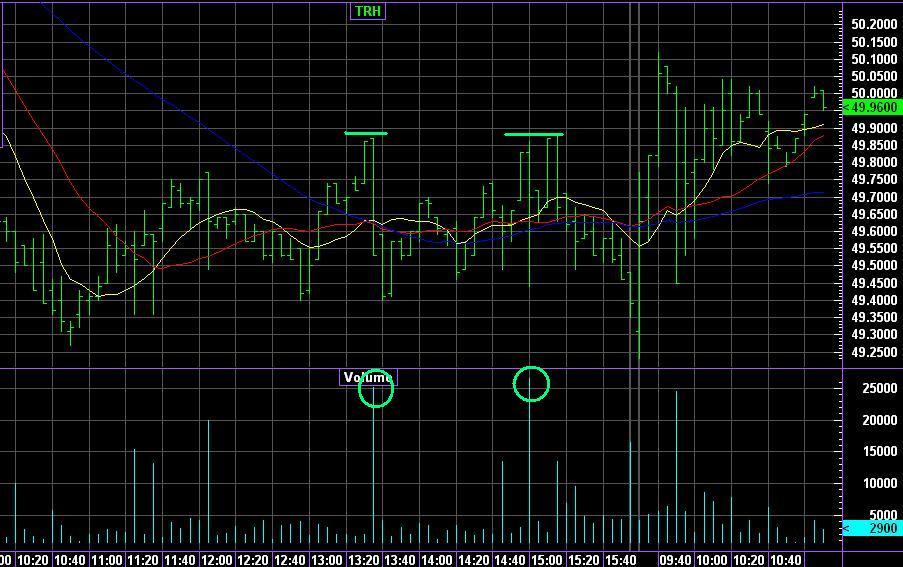
The opposite situation is correct for the stock bouncing off of the Resistance level. It is related to a presence of a big Seller in this particular stock. Every time the stock prices reaches that level, this Seller starts to sell stock, bringing more supply to the Market, which causes the stock price to go lower.
We can see an example of such scenario on Picture 2. Here we can easily notice an increase in Volume every time the price gets to the $49.85 level. The Seller starts to sell its position, which sends the stock price down.
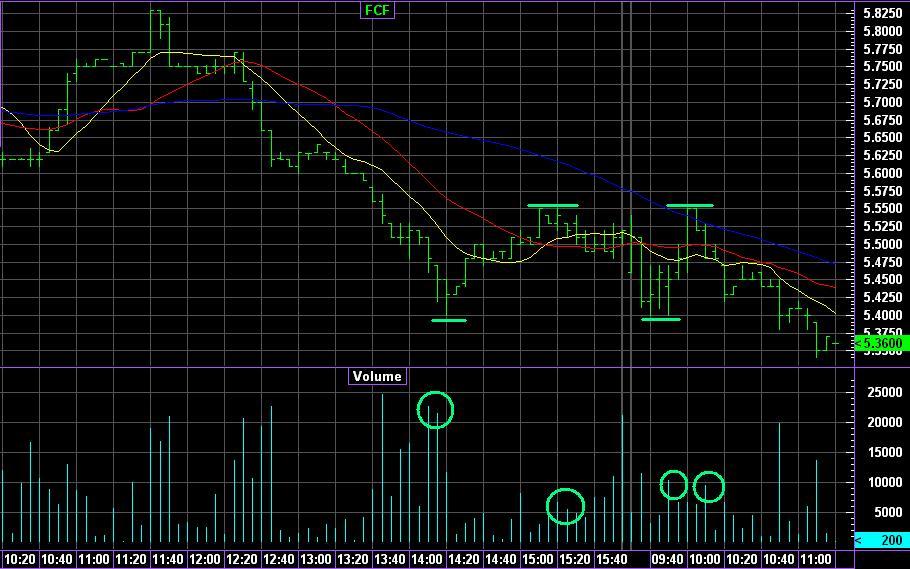
There is a third scenario possible, where there are both a big Seller and a big Buyer present. Usually this situation called trading Range. The price is moving inside a Channel bouncing off of the Support and Resistance levels every time it reaches them. It can be compared with playing tennis. Two partners bounce a ball to each other. The same is correct here as well. When price reaches the Support level where the Buyer is, he starts to buy and the stock price moves up. When it reaches the Resistance level, the Seller starts to sell and sends the price down, back to support line.
We can see this scenario working on Picture 3. Here the price fluctuates between the $5.40 and $5.55 levels.
Knowing these hints will help you to easily identify the direction of the trend for this particular stock in the nearest future and pick it up. Your positive P/L will be your proof and reward for using these tips.
Happy trading!
Roman Larionov is the founder of the Absolute Resolution Project, managed by the Absolute Resolution Consultants – New York based consulting company established in 2007. He has 12 years of experience including senior and executive management positions, project management, revenue management, sales, product development, people management and customer service. His trading experience includes 8 years of trading FOREX and NYSE equities.
Mr. Larionov holds two Bachelor’s Degrees in Management and Management of Crisis Situations along with the MBA degree in International Business.


