A Trading Strategy Using Gann Swing Charts
Several months ago I wrote an article about the Gann Swing chart or Gann Trend Indicator. This article will be about one of the exceptions to the rules laid out for the trend indicator. While the swing chart helps to identify where the trend will turn up or down, knowing when to use exceptions to the swing chart can help a trader enter and exit before an actual change in trend takes place.
Click here to order your copy of The VXX Trend Following Strategy today and be one of the very first traders to utilize these unique strategies. This guidebook will make you a better, more powerful trader.
One of the issues that comes up when trading with a long-term trend indicator is dealing with the giving back of open position profits. Proper use of an exception to the swing chart can help a trader move a stop before the market gives back a substantial amount of an open position profit. In addition, counter-trend traders can use one of the exceptions to enter the market before the trend actually turns to up or down. It should be noted that using an exception to the swing chart can often increase the frequency of trading.
The 2-Bar Swing Chart Recap
To recap what was covered in a previous article, creating a Gann Swing Chart is an important first step in using Gann analysis because it identifies the trend and the important tops and bottoms from which to draw the Gann angles which is more advanced Gann analysis. In addition, the chart provides valuable information to the trader such as size and duration of the swings. This information helps the trader find price and time targets and to identify when the market is ahead or behind target.
Gann Swing Charts can be created for the minor trend or the main trend. Some analysts prefer the minor, intermediate and main trend outlook. For this article we will use the 2-bar swing chart as our main trend indicator. A 2-bar swing chart measures swings only after the market has made two consecutive higher-highs or two-consecutive lower-lows.
A minor or 1-bar swing chart would follow the one day swings of the market.
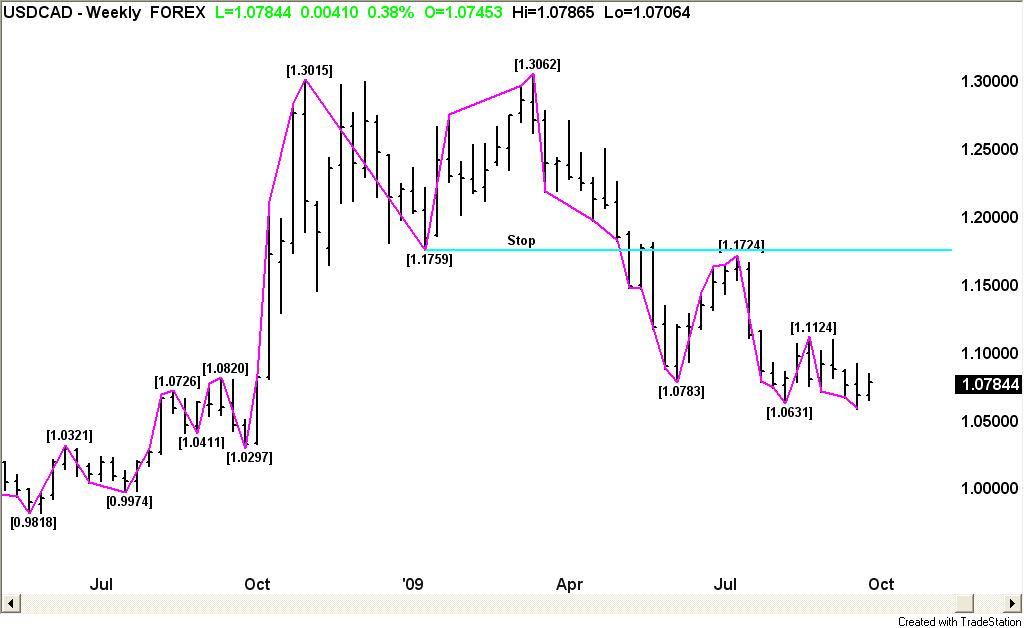
The main trend swing chart, or 2-bar chart, follows the 2-bar movements of the market. The combination of a main trend line from a main bottom and a main trend line from a main top forms a main swing. This is important information, because when stop placement is discussed, traders will be told to place stops under main swing bottoms, not under lows, and over main swing tops, not over highs.
Figure 1

Once the first main top and bottom is formed, the trader can anticipate a change in the main trend. Starting from the first day of trading, if the main trend line moves up to a new high, this does not mean that the main trend has turned up. Conversely, if the first move is down, this does not mean the main trend is down. The only way for the main trend to turn up is to cross a main top, and the only way for the main trend to turn down is to cross a main bottom.
In addition, if the main trend is up and the market makes a main swing down that does not take out the previous main swing bottom, this is a correction. If the main trend is down and the market makes a main swing up that does not take out the previous main swing top, this is also a correction.
A market is composed of two types of up and down moves. The main swing chart draws attention to these types of moves by identifying trending up moves and correcting up moves, as well as trending down moves and correcting down moves.
An Exception to the Swing Chart
The two most important exceptions to the trend indicator rules are the signal top and the signal bottom. I have studied this formation extensively and have concluded that these are universal patterns. In other words, it does not matter which market is traded: at some point they all post either a signal top or signal bottom at major tops or major bottoms.
Signal Top
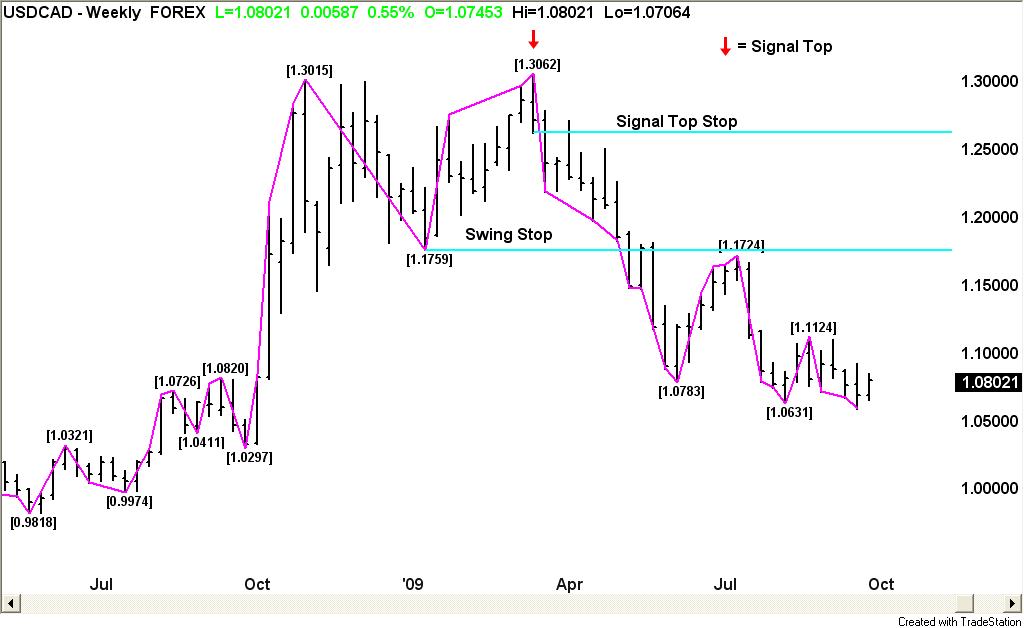
A signal top can be defined as follows: following a prolonged move up in terms of both price and time, a market has a higher-high than the previous time period, a lower-close, a close below the time period’s mid-point, and a close below the opening. If this occurs, consider it as a sign that the market has topped and that the trend is getting ready to turn down.
Figure 2

This signal alone may not be enough to trigger a sell, because often there is no follow-through break, and the uptrend resumes. The follow-through break is necessary, as it confirms the signal top formation.
The signal top is often called a closing price reversal top or a key reversal top, but these terms are not as specific as a signal top, as neither mentions the close below the day’s midpoint, the close below the opening, or the follow-through break, nor the prolonged move in price and time.
Signal Bottom
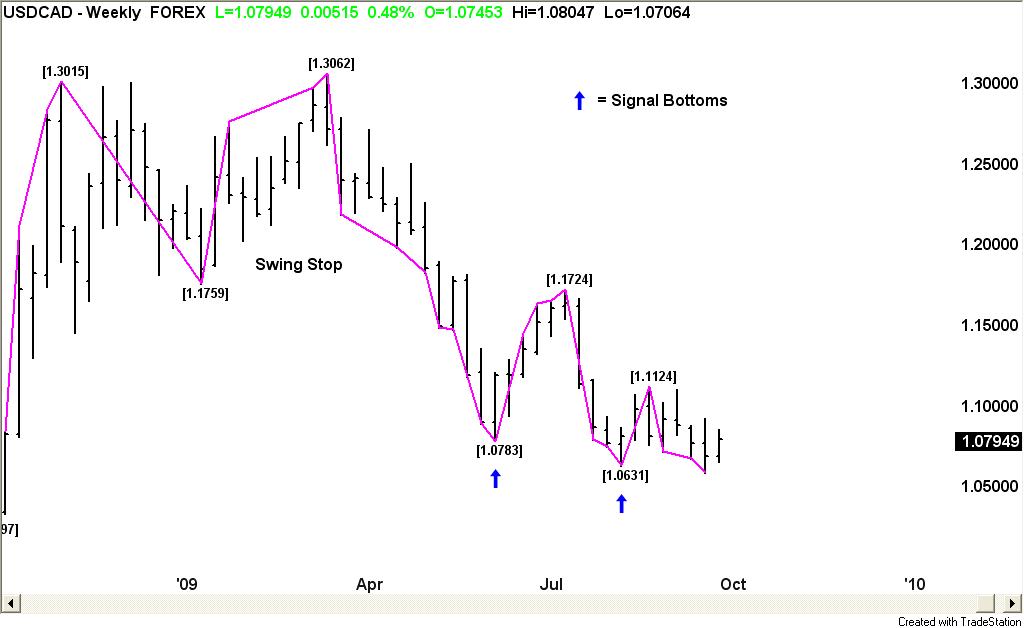
A signal bottom is defined as follows: following a prolonged move down in terms of both price and time, a market has a lower-low than the previous time period, a higher-close, a close above the time period’s midpoint, and a close above the opening. If this occurs, consider this a sign that the market has bottomed and that the trend is getting ready to turn up.
Figure 3

Like the Signal Top, the signal bottom needs to be confirmed by follow-through buying. This usually takes place during the next time period after the bottom when the market takes out the previous time period’s high.
Conclusion
These two exceptions, signal tops and signal bottoms, to the standard stop rule are designed for aggressive traders who want to lock in profits before the market retraces all the way up over a swing top or through a swing bottom. It should be noted that these stops when executed do not represent a change in trend, but are often important indicators of changes in trend that are going to take place in the very near future. These stops are also very effective in active, fast-moving markets when the market makes several large swings over a short period of time.
James A. Hyerczyk is a registered Commodity Trading Advisor with the National Futures Association. Mr. Hyerczyk has been actively involved in the futures markets since 1982 and has worked in various capacities from technical analyst to commodity trading advisor. Using W. D. Gann Theory as his core methodology, Mr. Hyerczyk incorporates combinations of pattern, price and time to develop his daily, weekly and monthly analysis.
His published works include articles for Futures Magazine, Trader’s World, SFO Magazine, Forex Journal, and Commodity Perspectives (Commodity Research Bureau), and, his book Pattern, Price & Time published by John Wiley & Sons, Inc. in 1998.
