A Trip To The Pound
Semiconductors have been
in free fall for quite some time now. It’s about time we gave this group a little
attention. I didn’t say love…just attention. This sector continues to be the
dog at the pound that no one wants. You know the kind. It has bristly brown
and gray hair, no meat on the bones, while the back right leg gets the shakes,
and drool is coming out of the corner of its mouth. You feel sorry for the old
beast, but no one is willing to get in the cage and pick it up.
I realize the state of Semi’s
are not pretty, but I want to make some random musings about this sector as
we drill down through the SOX index.
First, lets take a peak
at the WEEKLY chart of SOX.X. Below I find a few things interesting here.
1. There have been three
prominent legs to this decline since March 2000.
a. Leg #1: 37 weeks
Down 62%b. Leg #2: 34 weeks Down 55%
c. Leg #3: 31 weeks Down 65%
2. Something also interesting
to note is the symmetry of the last two legs of this decline.
a. February 3 2001 to
September 29 2001 SOX.X went down 419 pointsb. March 9, 2002 to October 07, 2002 SOX.X is down 421 points
3. Something else to note
on this chart. I see at least 4 rallies in this decline that were at least 40%.
In fact the last rally from September 29, 2001 to March 9, 2002 was 87%. That’s
right 87%!

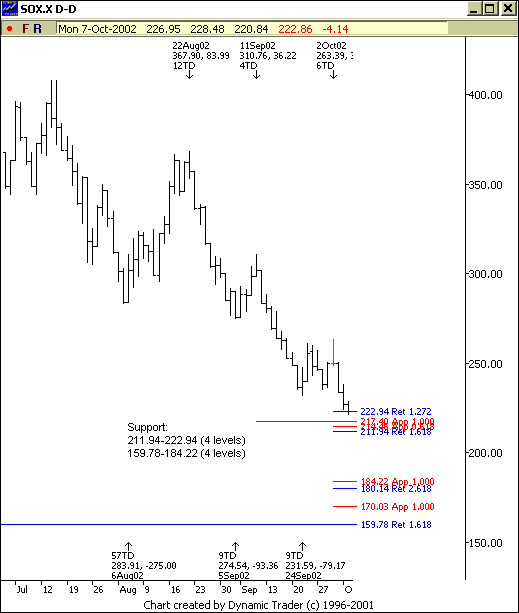
Now, let’s look at the daily
chart of SOX.X and we can see a couple of Fibonacci price support zones coming
up on radar.
1. The first support zone
is from 211.94-222.94 (4 levels)2. The second zone is from 159.78-184.22 (4 levels)
So, as I see the weekly
charts hitting similar percentage decline levels where previous declines ended,
I see that we may find support area on the daily chart and even look for triggers
to nibble on the long side. I’m not screaming buy here. I am simply pointing
out the extreme oversold nature of this market and the fact that we have Fibonacci
zones to possible hold the market here. I know that I am not interested in taking
shorts at these levels.

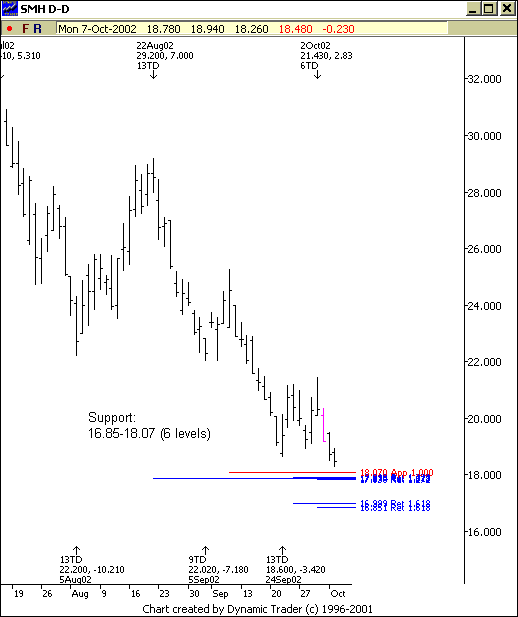
The way to trade this index
could be with the Semiconductor Holders
(
SMH |
Quote |
Chart |
News |
PowerRating). As I look at a daily chart
of this Holder below I have a nice Fibonacci price support zone from 16.85-18.07.

So, let’s see what happens
with this ugly dog around our Fibonacci support levels.
Good night!
Â
Â
Â
Â
Â
