A truly predictable intraday price pattern
Great Morning!
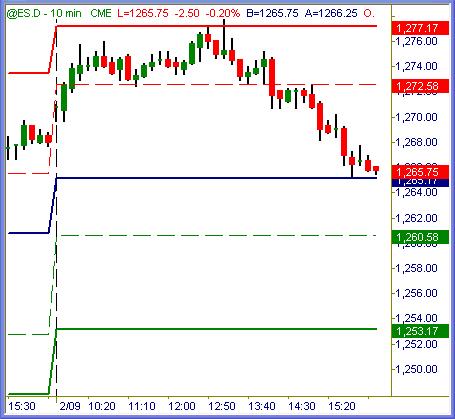
Thurday’s session was interesting. A quick ramp
off the opening bell went sideways for hours. We’ve seen this pop & flat coil
pattern many times before, and so it came to pass.
S&P 500 futures rolled between R1 and R2 values
from roughly 10:00am thru 2:00pm est. Once they broke ’em down back thru R1
support, it was a lead-pipe lock to tap the pivot point from there. Sure enough,
they hit the daily pivot on exact low tick of the day. Some things truly are
quite predictable via intraday price action when it comes to emini trading.

Russell 2000 futures lagged the S&Ps again.
Popped higher, limped sideways and made the surge-driven break back thru R1
levels on its way to the daily pivot point. A bear-flag pause between 726 ~ 724
was high-odds to hit 721 or lower. Indeed it did.

We noted in yesterday’s piece here that 1278
would be a prime magnet for price action to hit and stiff resistance for the
bulls. That mark did have sell stops clustered there, which rained down on bulls
into the afternoon swoon.
Such quick rejection off test of resistance is
quite bearish indeed. Daily chart picture remains sideways gyrations in rolling
consolidation, but the little signs all point toward lower price levels ahead.

Small caps remain the stalwart of stock index
bulls. Price action did attempt to close back above 38% but failed to do so…
no confirmation of continued strength, actually hints of weakness here as well.
This index remains bullish until 715 support gives way on a daily candle close.
With current trading at 719ish as we head toward the open of trading today, that
downside confirmation could be mere hours away from now.
Less Is So Much More
I get a fair amount of email from traders of all experience level, and
appreciate each one. I definitely learn as much about human behavior = trading
by reading them as (hopefully) the email authors glean from my response.
One thing I’ve seen literally, honestly thousands
of times in my online career has been the gross amount of information overload
many traders succumb to.
It is basic human nature to assimilate
information in order to find solutions for any question. That’s how we are
designed. Humans also have a natural compulsion to complicate things. Take one
look in the den or garage of an avid golfer and just count how many discarded
drivers, clubs, gadgets and widgets clutter the corners everywhere you look. The
same principle of complexity and overload applies to every pursuit in life,
trading included.
How many charts = workspaces have you seen with
more than a couple of indicators in use? I commonly see traders trying to watch
volume, MACD, stochastics, RSI, moving averages, TICK, TRIN, VIX, Fib
retracements, Fib projections and trendlines all at once. Now, I’m sure there
are many successful traders who manage to juggle this complexity just fine.
But… is all of that really necessary?
I don’t know about you, but I myself cannot make
trading decisions from within a view so cluttered with indicators it’d give
Stevie Wonder a headache. The good news? Such is not needed for intraday trading
success.
Market Myths
It’s a natural assumption of traders (been there myself) that watching a maximum
amount of indicators = filtering out the highest percentage of wins. After all,
when every indicator aligns correctly, how could that specific trade possibly
lose?
I submit to you that when all planets align on
the chart, such a trade setup may very well have 99% chance for success. Trouble
is, how often does that happen in reality? Almost never. Meanwhile, traders are
left to decide what action is appropriate when any seven out of twelve
indicators are bullish while the rest are bearish or neutral. That is what the
vast majority of trade setups look like inside cluttered charts… confusing.
Anyone who wants to watch a chart workspace more
complex than aircraft controllers could decipher are of course most welcome to
do so. By the same token, traders who actually enjoy hours and hours of charting
and research in attempts to guess (correct word) which way next for price
action may derive more out of the process than just potential to make money.
Believe it or not, there are all sorts of emotional rewards available in the
trading profession beside monetary gain. Topic for discussion some other time.
Vendors who offer information to the public
unwittingly promote the concept that more is more. I have purchased numerous
educational packages for hundreds and (many times) thousands of dollars to learn
what I can from each. In all honesty, I myself have always learned the most
pertinent info from the smaller, concise packages. Slap a mega-hundred page
manual and/or multi-disc DVD package with endless hours of digestion upon me,
and I’m sure to quit studying that approach far sooner than the end.
Perhaps people believe they get their money’s
worth from an educational package that doubles as a boat anchor. At this
advanced stage of my evolution as a trader, I firmly feel that less is decidedly
more.
These days, my workstation for emini trading
consists of two charts, and only one of the charts is really necessary. The
other is still there to make me feel good… it helps. I watch one custom
indicator that turns green when price action is likely to continue higher, and
it turns red when price action is likely to continue lower. At a glance it is
very clear whether the emini market is in buy or sell mode. No darting of the
eyes across a half-dozen flittering filters trying to discern which is doing
what.
Once the quick glance shows bias indicator red or
green, I simply wait for short or long signals to confirm on the chart. Patience
pays in this game… true for all timeframe of traders. Of course the process
does require some degree of thought and decision making on my part. But, the
thought sequence is brief and simple as possible. I require a trading method
that is simple, clear and visual for my own success. Traders who are smarter
and/or more intellectual than me might be able to manage a workspace that
resembles the space shuttle’s instrument panel. In all honesty, I cannot. The
good news is, none of that is necessary in order to enjoy methodical trading
success.
Summation
As I always say, there are at least 1,000 ways to succeed as a trader. The
number of ways to fail are fewer. One of the major stumbling blocks on our
individual roads to success is trade signal complexity. The gist of trading lies
heavily towards trade management. Ideal entries are easiest to learn. I prefer
to spend my time and focus on maximizing trade management efficiency. That
includes taking one trade after another in the natural process of profit & loss.
The easier it is to see = act upon valid trade entries, the more enjoyable my
profession is to me.
I would respectfully suggest each of us take a
close look at our charts today. If it requires more than five seconds to
determine if we should be short, long or flat, our decision process is
inhibited. One way of making our trade entry process more efficient is to reduce
the number of data points needed for decision. Red or green at a glance works
for me, but to each their own.
Trade To Win
Â
Austin P
[Online
video clip tutorials…
open access]