Add These Levels To Your Trading Plan
What Tuesday’s Action Tells You
The major indices had a positive change in
direction day yesterday having bounced off their 20-day EMAs and providing
daytraders with a good trading day. The SPX
(
$SPX.X |
Quote |
Chart |
News |
PowerRating) closed at 1029.03,
+0.6%, the Dow
(
$INDU |
Quote |
Chart |
News |
PowerRating) 9576, +0.4%, while technology led, as the Nasdaq
(
$COMPQ |
Quote |
Chart |
News |
PowerRating) at 1902 was +1.4%,
(
QQQ |
Quote |
Chart |
News |
PowerRating)s 34.49, or +1.7%, and the
(
SMH |
Quote |
Chart |
News |
PowerRating)s +1.6%.
In the other major sectors, the BKX, XBD, CYC,
BBH and PPH all advanced in line with the SPX, while the RTH was +1.3% and the
OIH almost flat at -0.1%. NYSE volume was 1.3 billion shares, volume ratio 67,
and breadth +766. Two negative threads yesterday was the defense group decline
on a downgrade by Smith Barney with a reason that makes his vote for Ms. Clinton
obvious. The telephone bells also sold off as a group as Verizon said they will
fall short for 2003. Here we go again. Yesterday’s market action keeps the major
indices above all of their primary rising EMAs, so any subjective market comment
means nothing unless there is a negative change in this price action.
For Active Traders
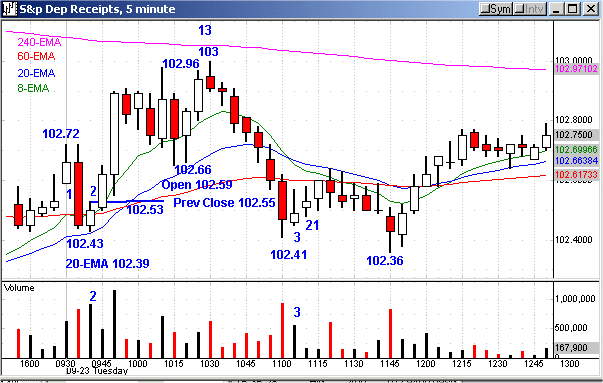
Traders started yesterday with price bracketing
inflection point levels, and this resulted in solid trade setups in both the
major indices and the correlated big cap stocks. I have included a chart of the
(
SPY |
Quote |
Chart |
News |
PowerRating)s which outlines the trade setups around the 20-day EMA and gap from
the previous day. The SPY started with a gap pullback setup with a signal bar
low of 102.43, which was a narrow-range bar with an increase in volume (2). The
SPY had opened at 102.59 (1). The 20-day EMA was 102.39, and the signal bar low
was also right at the 20 EMA on the five-minute chart. Entry, if taken, was
above 102.53.
The SPY traded up to 102.96, the beginning of the
102.96 – 103.40 gap. It backed off to 102.66, then traded up to 103 with the 240
EMA at 103.02. The 103 reversal bar was also the 13th trading bar, so you had
confluence now with the 240 EMA, the gap zone, 13-bar Fib time, and 102.90 was
the 1.618 Fib extension of the 102.72 – 102.43 leg down. What decision did you
make? If you were long the initial setup, did you reverse and go short at the
confluence?
The SPY traded down to a new intraday low of
104.41 and back to the 20-day EMA of 103.39. This was not a very good setup, as
the inside bar (3) opened and closed below the mid-point following the
wide-range-bar 102.41 low, but did have some volume increase as traders looked
to play off the 20-day EMA again. The bar following the inside bar was the 21st
bar with a higher high and low, so if the dynamics looked okay to you, you could
certainly take that setup.
The SPY went dead for the next 45 minutes and
made the 102.36 low, followed by a change-in-direction bar which re-crossed the
20-day EMA to the upside. Entry was above 102.51 if you hadn’t already entered
on the re-cross of the 20-day EMA. It was trend up to a 103.29 intraday high
before fading to a 102.94 close right at the 240-day EMA (not shown). This long
setup was also at the .618 retracement zone to Monday’s last swing point low.
Key point is that you get opportunity most often around awareness levels which
should be in your trading plan prior to the day’s trading.
The QQQs gave you a gap pullback, then a .618 Fib
retracement long entry on the 11:45 a.m. ET retracement to Monday’s last swing
point low. This was followed by a Slim Jim at the 240 EMA between 34.20 – 34.12
and even a second Slim Jim between 34.32 – 34.20. After that setup, the intraday
high was 34.55, closing at 34.50. After the .618 retracement entry above 34.06,
there was nothing resembling a stop problem, as it was trend up into the close.
All of those trades in both the SPY and QQQ are in my trading modules and repeat
day after day to varying degrees. The SPY chart was cut short, so it didn’t show
the same Slim Jims as the QQQs did, but we cut it off that way just to give you
the entry clarity.
Today’s Action
The early futures are green at 8:00 a.m., and we
start today with a change-in-direction bar yesterday for the major indices with
closes in the top of the range, so we know where continuation is. The first
downside levels are still the 20-day EMAs. Avoid first entry continuations today
after the trend up afternoon yesterday. We have entered a very volatile time
period, in addition to the daily barrage of terrorist, earnings season and now
dollar focus news. Retracement entries at the lowest common denominator make the
most sense to me for any position trades.
Have a good trading day,
Kevin Haggerty