After Friday’s pause, I’m expecting a directional move today
Friday’s session was one of
consolidation. 2.5 days of heavy selling (with an expected pop at the end) begat
a day of rest.
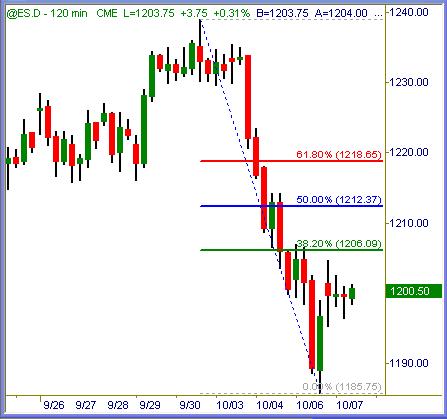
ES (+$50 per index point)
S&P 500 stares at 1206 and 1212 as the next
areas of resistance above. It may take a couple of sessions to get there, but we
should see these levels tested soon.

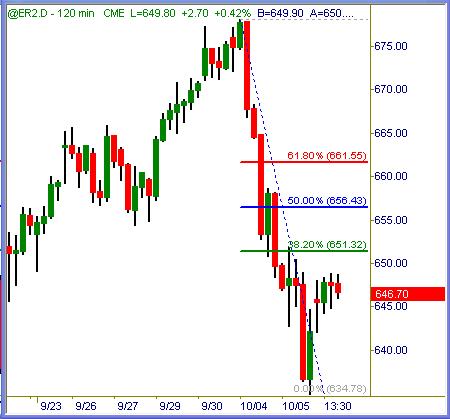
ER (+$100 per index point)
Russell 2000 also marks 651 and 656.50 for
potential clustered sell stop orders upside. As with ES also, those 62% values
would be last lines in the sand for sellers before the tape turns bullish bias
again.
These specific levels will magnetize price
action if touched, and should create predictable trading patterns short below or
long above when they come into play.

Today’s Session:
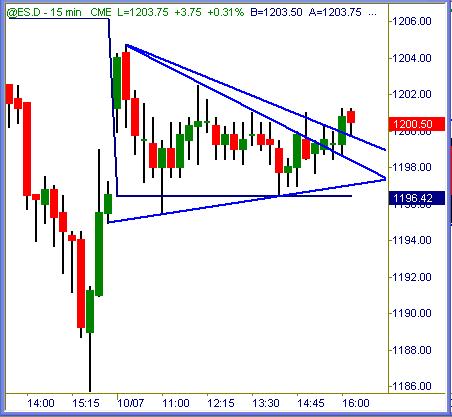
ES (+$50 per index point)
S&P 500 took Friday’s occasion to wedge
itself up. Depending on how the upper line is drawn (patterns are subjective and
evolving) we see where resistance was broken into the closing bell.
It was a small-range day, setting up this
session for expanded distance covered and possibly directional action.

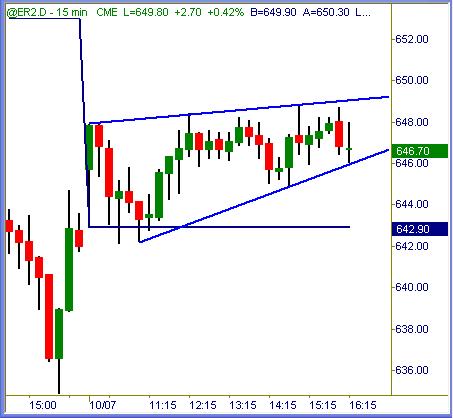
ER (+$100 per index point)
Russell 2000 futures are also flagging
sideways, albeit upward fashion. Top line should be support for further upside
while lower line may get bumped a few times in pullback fashion to test
resistance on continued selling.

Summation
The weekend Market Outlook section
here (free
public access) goes into detail about stock index trends, bias, etc. Trading it
one day at a time, this week has high potential to offer some directional moves,
normal intraday ranges and less wild volatility than witnessed last week. As
always, trust the method signals long or short and let its positive performance
expectancy take over from there!
Trade To Win
Austin P
(free pivot point calculator, much more inside)
Austin Passamonte is a full-time
professional trader who specializes in E-mini stock index futures, equity
options and commodity markets.
Mr. Passamonte’s trading approach uses proprietary chart patterns found on an
intraday basis. Austin trades privately in the Finger Lakes region of New York.
