After Last Week’s Energy Decline, Check These Stocks
What Friday’s Action Tells
You
The SPX
(
$SPX.X |
Quote |
Chart |
News |
PowerRating) and Dow
(
$INDU |
Quote |
Chart |
News |
PowerRating)
made new three-year highs on 03/04 and again on 03/07 with the SPX 1229.11
high.
The highs reversed on the 03/08 time date and finished negative on the week,
and
in fact, they are now red year-to-date with the Dow -0.08, the SPX -1.0, RUT
-3.8, Nasdaq
(
$COMPQ |
Quote |
Chart |
News |
PowerRating) -6.2 and NDX 100 -7.1.
Last week, the economically sensitive stocks
did
the best, and certainly the specialty metals with the XAU +2.2% and HUI
+2.0%.
The energies led the downside, along with the financials, like utilities
($UTIL), the XBD and BKX. The
(
IWM |
Quote |
Chart |
News |
PowerRating) was -2.8%, and the consumer index
(CMR)
was -1.4%. The US Dollar was off -1.3% despite the rise in bond yields. The
10-year was +.23 basis points to 4.54 and the long bond +.16 basis points to
4.81.
Friday’s market action, with the SPX and Dow
off
-0.8% and -0.7% with the
(
QQQQ |
Quote |
Chart |
News |
PowerRating) -0.9% and Nasdaq -0.5%, was a carryover
from what I said was a disconnect on Thursday with the SPX and Dow up, but
negative divergence with the internals.
NYSE volume on Friday was the lowest of the
week
at 1.4 billion shares, with the volume ratio 37 and breadth -692. The
short-term
condition has just entered oversold territory with the 4 MA of the volume
ratio
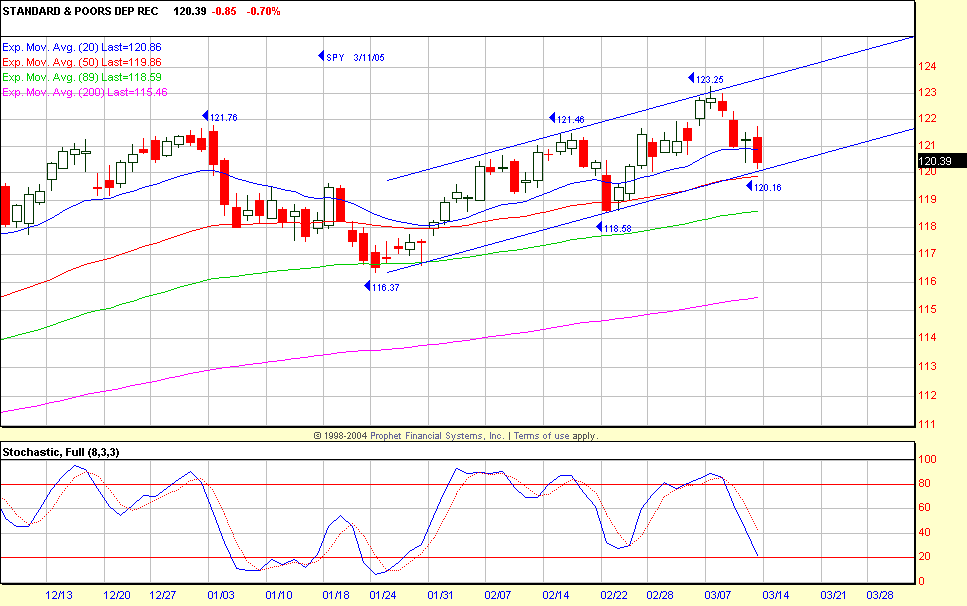
now 34 and 4 MA of breadth -1056. This coincides with what I said in
Friday’s
commentary that the initial potential trader’s reflex level would be
119.80 –
120 on the
(
SPY |
Quote |
Chart |
News |
PowerRating), which closed at 120.39 after hitting a 120.16 intraday
low. If this up trend that started 01/24 from the 116.37 low is to continue,
the
02/22 118.58 low must hold, but the trend channel and 50-day EMA is 119.80 –
120, so if the next up move to 124 is to happen, it should come from that
zone.
If not, an ABC correction can develop with a price objective below 1170. For
the
(
DIA |
Quote |
Chart |
News |
PowerRating), which closed at 107.88, the same level 107.65 – 107.70, and
Friday’s
intraday low was 107.65, so we’re right at that channel level. The SPY
closed at
120.43, just below my first upside line of 120.62, so that is the initial
key
for Monday and last week’s 120.16, in addition to the 119.80 – 120 zone as
the
mini-downside focus. In addition, today is the 34th day from the Jan. 24
low, so
we have some time symmetry.
With last week’s energy decline, traders
should
check the “Above the Line” stocks that have retraced to their 20-
and 50-day EMAs, like
(
CVX |
Quote |
Chart |
News |
PowerRating) and
(
SLB |
Quote |
Chart |
News |
PowerRating). If possible, the Generals’ major
energy holdings
will be marked up into the end of this first quarter.
Traders that took the
Trap Door/RST short
below
SPY 121.54 after the 121.72 high, which was at the 480 EMA started the day
in
the green. This level was also the SPX 1212 .382 retracement to the 1229.11
high. The SPY traded down to a 120.16 low and 120.39 close, while the SPX
had a
1998.15 low, closing at 1200.09. If there is a drop below SPY 118.58 this
week,
those of you in the
Inner Circle or who have the
seminar materials are
alerted
to the next setup (count to the left).
Have a good trading day,
Kevin Haggerty
P.S. I will be
referring to some charts here:
www.thechartstore.com in the future.

