All Eyes On The ECB And The Bank Of Japan
With
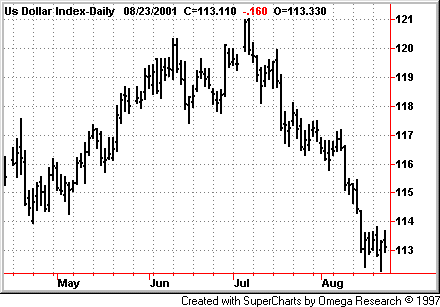
the dollar in a runaway decline and the Euro in a runaway rally, the
market environment of the next few months is now becoming very critical.
The Fed’s rate cutting can cushion our domestic decline, but cannot fight
global deflation alone. Every Fed rate
cut has been somewhat neutralized by eroding weakness in Europe, Japan, and the
rest of the world. The Fed cannot act as
the sole reflationist and expect to get a global recovery underway.
And without global recovery, any recovery in the U.S. economy will be
weak and temporary.
The
dollar decline MAY be enough to kick the ECB and Bank of Japan into reflationary
action in a more aggressive manner. Now with the dollar weakening
in the absence of European and Japanese improving economic outlooks, there is
more reflationary pressure than ever on the central banks of the two next larger
economies of the world.
The
problem is that the ECB and Bank of Japan have made numerous policy errors in
the past, and blowing it here could mean global recession and a much more severe
market downturn everywhere than we have yet seen.
So, investors must start to watch the actions of the ECB and Bank of
Japan like a hawk. Next week the ECB
should cut rates again.yes”> If European stock markets respond with high-volume rallies, Euro
bonds decline, and the European currency picks up a bit, this will be positive
and mean the world is anticipating enough reflation by the ECB to begin a
recovery. BUT if the European stock
markets don’t pick up on high volume, and if the rate cut is minor and the
indications of further rate cuts are not made clear, we must continue to be
super cautious in global stock markets and consider the possibility that this
downturn will be much longer and broader than the markets are currently
anticipating. Stocks, bonds, and the
action of the dollar will tell the tale. And
investors must continue to monitor these markets’ reaction to ECB and BOJ
actions to determine which major direction the U.S. and global economy will
embark upon. It’s crunch time for central
banks!
Right
now yet breadth
remains mixed with no real evidence of strength to either the bulls or the
bears. We still need some follow-through
days and evidence of breadth entering the market on the bullish side before we
can assume an intermediate-term low is upon us. Continue
to watch closely for two or preferably more of the breadth-thrust indicators
we’ve been enumerating for the last few weeks to materialize before getting
exciting about a sustained bullish move.
Economically
sensitive commodities are still troublesome. Bonds
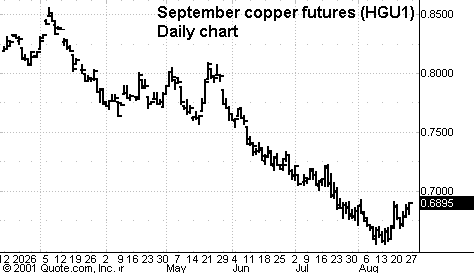
are behaving bullishly, copper is rallying off of new lows but not forming any
major bottom formation yet, cotton made new lows, and lumber is gyrating all
over the place, though still generally strong. Thus,
the best economically sensitive economies seem to be saying that broad housing
will hold up OK, but the rest of the economy is still likely to drift lower
without recovery for the next three months at least.
A sharp move down by bonds and up by cotton and copper will tell us that
the markets are finally starting to anticipate a sustained economic recovery.
Until we get this, we would be surprised to see a sustainable up-move in
stocks in general. Â
AÂ
look at the numbers from our stock lists tells us that the trading-range
environment continues. Wait for real indications of breadth one way or another,
which appears absent right now. New
Highs vs. New Lows on our RS/EPS lists were
28/35, 25/28, 28/27, 29/23 and 12/33 — showing no strength to the bulls and the
first week of 20+ lows consistently for months. Continue to wait and watch for something real —
like days of new highs or new lows on our lists above 50 daily and above 100 a time or two
each week again before becoming eagerly bullish or eagerly bearish. This week, top RS/EPS new highs
(122) were swamped by bottom RS/EPS new lows (146), both in terms of overall
number and quality. There were a couple of
close calls on the 25 breakdowns of bottom RS/EPS new lows that broke out of
four-plus-week bases, while there were no close calls in the meager five
breakouts of bases of top RS/EPS new highs.
Our
overall allocation is now DEFENSIVE with 68% in T-bills awaiting new
opportunities. Our model portfolio
followed up weekly in this column ended 2000 with about an 82% gain on a 12%
maximum drawdown, following a gain of around 41% the prior year.
For year 2001, we are now up about 7% with a heavy cash position.
For
those not familiar with our long/short strategies, we suggest you review my
10-week trading course on TradingMarkets.com, as well as in my book “The
Hedge Fund Edge” and course “The Science of Trading.“Â
Basically we have rigorous criteria for potential long stocks that we
call “up-fuel,” as well as rigorous criteria for potential short
stocks that we call “down-fuel.” Each day we review the list of new highs on our “Top RS and EPS New
High list” published on TradingMarkets.com for breakouts of four-week or
longer flags, or of valid cup-and-handles of more than four weeks. Buy trades are taken only on valid breakouts of stocks that also meet our
up-fuel criteria. Shorts are
similarly taken only in stocks meeting our down-fuel criteria that have valid
breakdowns of four-plus-week flags or cup-and-handles on the downside. We continue to buy new signals and sell short new short signals until our
portfolio is 100% long and 100% short (less aggressive investors stop at 50%
long and 50% short). In early March
of 2000 we took half profits on nearly all positions and lightened up
considerably as a sea-change in the new economy/old economy theme appeared to be
upon us.Upside
breakouts meeting up-fuel criteria (and still open positions) so far this year
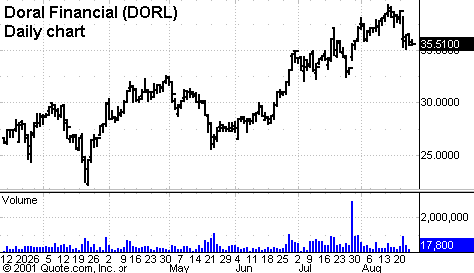
are: Doral Financial
(
DORL |
Quote |
Chart |
News |
PowerRating) @36.1 (36.46) w/34.75 ops. Continue to
watch our NH list and buy flags or cup-and-handle breakouts in NH’s meeting our
up-fuel criteria — but continue to add just two per week and only in leading
groups.
Â
On
the downside, this year we’ve had breakdowns from flags (one can use a down
cup-and-handle here as well) in stocks meeting our down-fuel criteria (and still
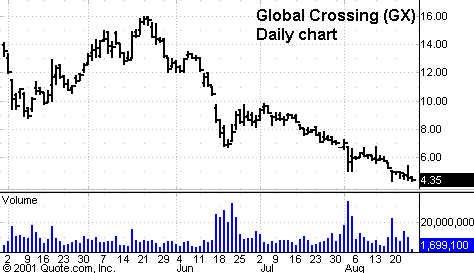
open positions) in: Global Crossing
(
GX |
Quote |
Chart |
News |
PowerRating) @6.05 (4.71) — now use 5.5 ops; Phelps Dodge
(
PD |
Quote |
Chart |
News |
PowerRating) @38.1 (38.67) — now use 41 ops; and new this week Brasil Telecom
(
BRP |
Quote |
Chart |
News |
PowerRating)
@31.69 w/35.5 ops. Continue to watch our NL list daily and to short any stock meeting our
down-fuel criteria (see 10-week trading course) breaking down out of a downward
flag or down cup-and-handle. Here
too, remain cautious by only adding two shorts in a week, until we get
more consistency in the number of downside breakouts in a given week off of our
Bottom RS/EPS New Lows lists.
BRP
gave a signal this week and may be a way of playing Argentina’s brewing problems
because Brazil and Argentina are closely linked.
BRP had earnings drop 77% and 24% in the last two quarters;
estimates for 2001 are -17%; it’s
in the Telecom group, one of the weakest according to our lists;
RS is 19 and EPS rank is below 30. The
stock broke down from a 30-day flag pattern on a gap and barely high volume.
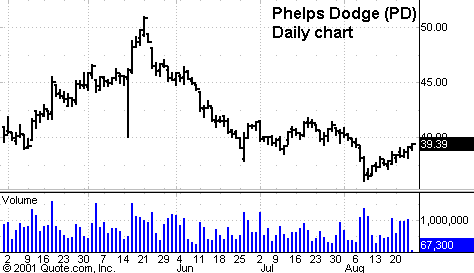
Despite
a few long/short opportunities we are currently trading, in general there are
very few trades developing in either direction here as the retest trading-range
market environment goes on and on and on. Patience
and selection will continue to pay dividends, although investors should be
prepared for some whipsaws in this environment. While
you remember that it only takes a couple weeks of good environment to make a
year’s worth of profits in these markets via our strategy, also keep a close eye
on Europe, Japan, and the markets’ reaction to their upcoming actions.
Wait till you see the whites of their eyes before wasting real allocation
bullets.Â
