All The News We’ve Been Getting Favors Daytraders
NYSE
volume was the lightest since Jan. 3 at 1.3 billion,
as the major indices declined for the
fourth day in succession. Another wide-range-bar close in the bottom of the
range. The volume ratio was just 15. Both the SPX
(
$SPX.X |
Quote |
Chart |
News |
PowerRating) and Dow
(
$INDU |
Quote |
Chart |
News |
PowerRating) lost 1.7%, while breadth expanded to 1223 for a three-day oversold
moving average of -681.The three-day moving average of the volume ratio slid to
27. There was a positive divergence with both the Nasdaq
(
$COMPQ |
Quote |
Chart |
News |
PowerRating) and NDX
(
$NDX.X |
Quote |
Chart |
News |
PowerRating) off only -0.9%.
The
(
SMH |
Quote |
Chart |
News |
PowerRating)s also
outperformed the SPX and Dow at -1.0% and are now down -11.4% over the past four
days. It was also the third day in a row of declining volume and narrowing range
for the SMHs as price declined. That gets me interested to play any longside
intraday setups. 22.54 is the .618 retracement to 17.32 from the rally high of
31 on Dec. 2. This current rally started from 22 on Dec. 31 and ran +20% to
26.44. This was just another missed move by the majority that only play the game
one way and fail to recognize the major buy opportunities in bear markets.
Against conventional wisdom? Maybe so. But all the way to the bank.
FYI: These are the same
people that didn’t sell the major indices last week on the retracement back to
declining longer-term moving average and at a defined resistance level. Most of
them don’t know what long-term symmetry is, so they can’t be held for that.
Since the Jan. 13 start of the time zone, the Dow has declined 400 points and
the SPX 40 points from 928 to 888, or -4.3%.
The indices are, of
course, short-term oversold, starting today. The SPX closed at 887.62 with the
.38 retracement between 954 and 769 at 883.36 with 884, which is the .50
retracement to the 1987 low from the 1553 all-time high. The 2.0 three-month
standard deviation band is about 878, and the 3.0 band is at 860, along with
861, which is the .50 retracement, and then you have the .618 retracement at
840.
For the SMHs, having
already penetrated the .618 retracement zone with the prior 22 low, you have the
.707 retracement at 21.33 and the .786 at 20.25. The 2.0 standard deviation band
is about 20.90 and the 3.0 band is down at 19.
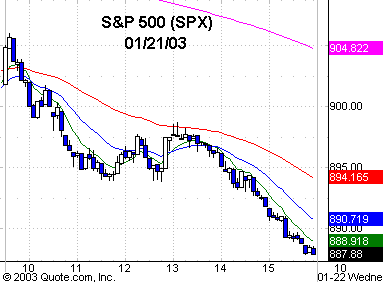
Yesterday provided a good
second-entry short trade below last week’s lows on the SPX as yesterday’s script
played out. After they took out last week’s lows of 90.15 on the SPY, the
reversal reflex up only carried to 90.49 and then reversed 90.15 to the
downside, giving you the second-entry short opportunity. For the SMHs, the
better trade opportunity will be if they take out the head-and-shoulder pattern
on the daily chart, taking price down below the .618 retracement zone and into
my favorite 2.0 – 3.0 standard deviation zone, which will provide a good
reversal trade.
With the heavy news we
have been getting, long term is now after lunch, so that favors the daytrader.
It is very difficult for money managers, which is the primary reason NYSE volume
has dropped off. Remember, trading is a series of probes with defined entries,
regardless of whether it is continuation or reversal. It is not a game of
absolutes.
Have a good trading day.

Five-minute chart of
Tuesday’s SPX with 8-, 20-,
60- and 260-period
EMAs

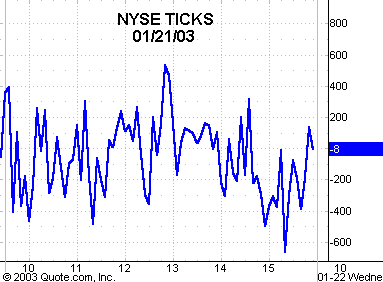
Five-minute chart of
Tuesday’s NYSE TICKS
