Anticipate It, Then Trade It
The market action–as
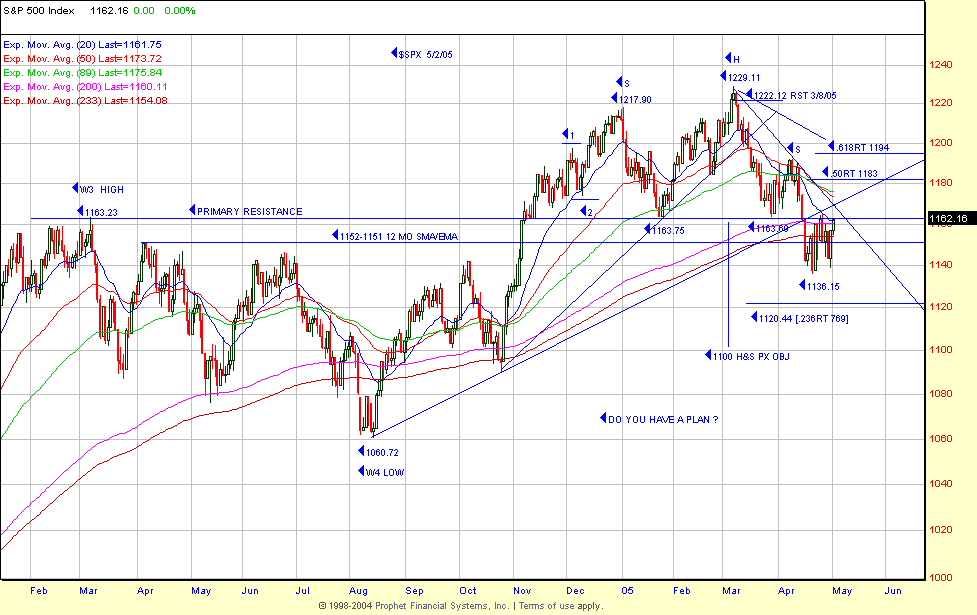
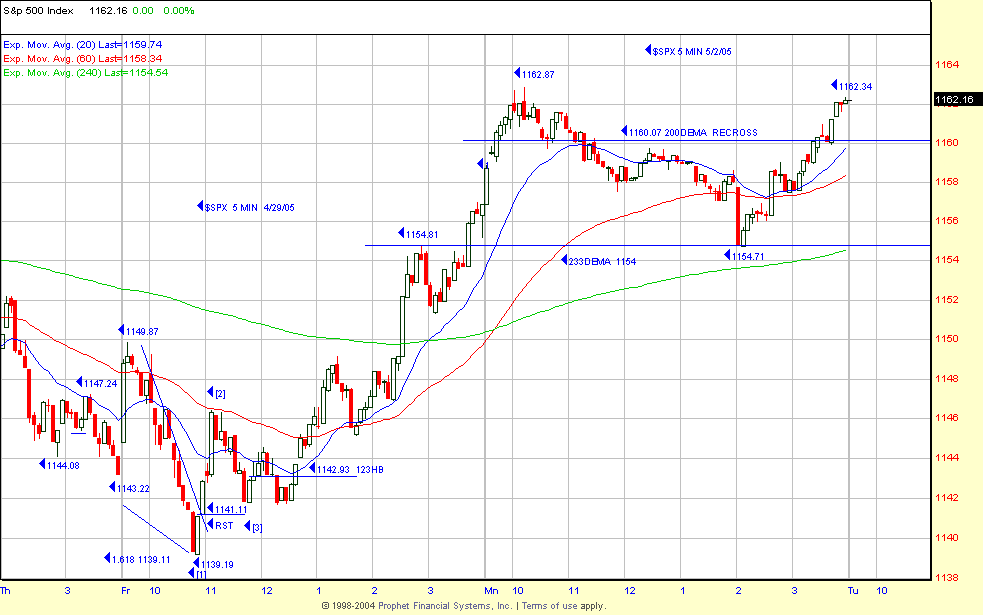
defined by the SPX–was another day pushing the 1160-1165 resistance
zone, with 1160 being the 200-day EMA and the other major resistance from
1163-1165, which includes the Wave 3, 1163.23 high (see chart). The SPX downside
yesterday was contained above the 1154, 233-day EMA, with an SPX low of 1154.71.
The close was 1162.16, +0.5% on the day. Daytraders that took the short below
1160 then covered and reversed at the 1154 zone made a few points.
It was nothing like the multiple RST trades, both
long and short, that have been available over the past ten or so days. FYI, the
initial RST sell (daily chart) was below 1222.12 on the key time date ofÂ
03/08.
NYSE volume was 1 56 billion shares, with the
volume ratio of 66 and breadth +984. The Dow was +0.6% to 10252 while both the
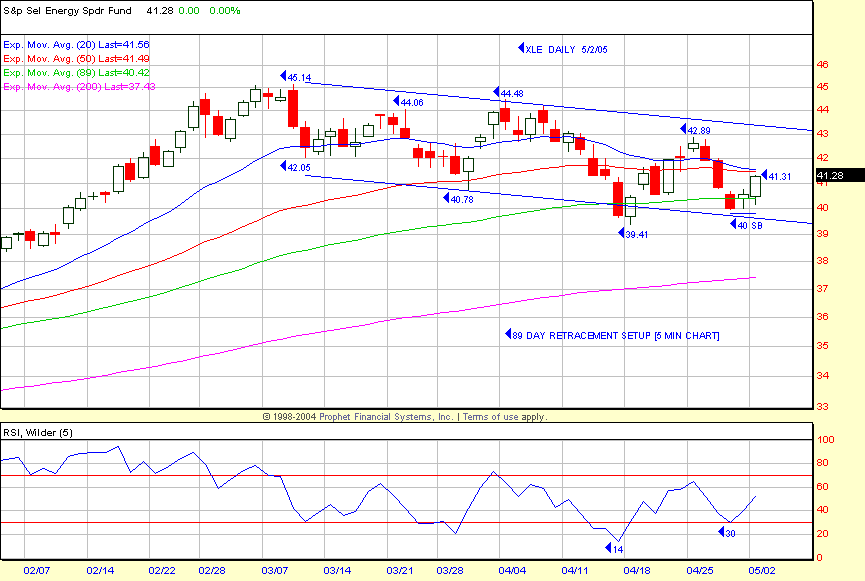
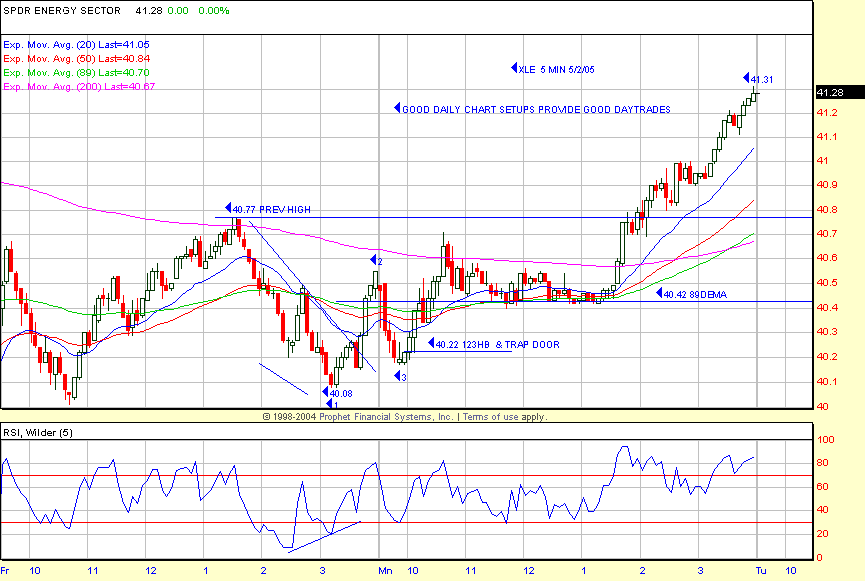
Nasdaq and QQQQ were +0.4%. The leading primary sector was energy, with the OIH
+2.8% and XLE +1.8% on a bounce from the retracement to the 89-day EMA.
Daytraders had good early entry before the re-cross of the 89-day EMA (see
charts). The XLE, along with the XLU and PPH, are “above the line” sectors, and
obviously a source of many long trade opportunities, which is consistent with my
stock selection method that some of you are familiar with. The brokers (XBD), on
a downgrade, was the only negative primary sector at -1.9%. Nothing very lasting
on the upside can happen unless the semiconductors and brokers provide upside
leadership.
Sorry to say we have to say the FOMC/Greenspan
show today, with a unanimous 0.25 increase consensus and the interest mostly
centered on the statement side. Maybe it will be more coherent than the March
doublespeak about larger inflation worries followed by weak economic numbers,
which accelerated the mini recession meltdown in the major indices and the
subsequent volatility around the longer-term moving averages. There is nothing
to plan for today, as any overreaction on the announcement is what provides the
contra-move. Should the SPX rally above the 1160-1165 resistance, sellers will
show up quickly at the SPX 1183-1194 zone (see SPX chart).
Have a good trading day.
Kevin Haggerty
P.S. I will be
referring to some charts here:
www.thechartstore.com in the future.


