Any Downside Follow-Through May Provide Opportunity
What Tuesday’s Action Tells
You
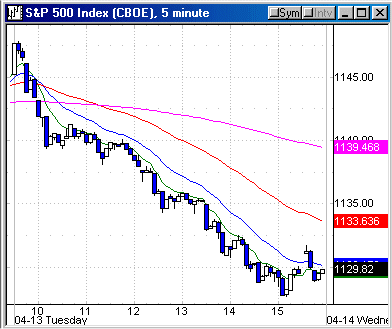
It was an air-pocket day in front of an option
expiration this Friday as the media made interest rates their panic focus
yesterday. Bonds declined, rates went up, the dollar advanced and stocks
declined, along with gold. The SPX closed at 1129.42, -1.4%, with the Dow, -1.3%
and Nasdaq, -1.7%, and QQQs, -1.4%. NYSE volume was just above its recent
average at 1.42 billion but was all one-sided with a volume ratio of 11 with
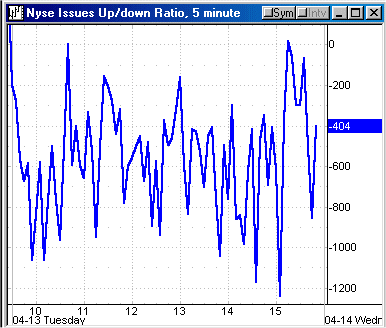
1.26 billion down. Breadth was just as negative at -2535. The 4-day moving
averages are now 36 for the volume ratio and -851 for breadth, so we’re getting
there.
The brokers
(
XBD |
Quote |
Chart |
News |
PowerRating), -2.8%, BKX, -2.2% and CYC,Â
-2%, led the downside in the primary sectors, while gold
(
XAU |
Quote |
Chart |
News |
PowerRating) was -6.1%,
led by NEM, -5.4% and FCX, -5.7%, which are two primary institutional
holdings. The TLTs were -1.1%, closing at 84.81. Net net, rates have been
advancing since the 3/17 lows. That should be no surprise with all of the “best
in 20 years” economic reports we have seen in addition to many other positive
numbers, not to mention the CRB, which has made a major move to new highs since
the 7/03 lows. When the economy recovers rates obviously go up and in the finale
you often see stocks, commodities and rates all advancing together. This is the
highest the CRB has been since the 1980 all-time high, so nothing is sneaking up
on anyone. The decline in the dollar has been a significant factor in the
advance in the CRB. While the media focus on the obvious, others who shorted the
TLTs, etc, have in addition to the obvious strength in the economy, watched the
13-week rate-of-change in M2 go negative from 1/19/04 through 2/16/04, preceding
the current advance in rates.
The primary price and volume thread you saw the
previous day in utility stocks was repeated again yesterday but also included
brokers, banks, savings and loans, retail and certainly the real estate sector.
The BKX closed at 98.48 and has some air below 97.74 with the next stop at the
200-day EMA down at 94.20. The 5-day RSI has some room to get what I callÂ
“trader’s oversold.”
| Â | Wed. 4/7 |
Thur. 4/8 |
Fri. 4/9 |
Mon. 4/12 |
Tues. 4/13 |
Index |
|||||
| SPX |
|||||
High |
1148.16 | 1148.97 | H | 1147.29 | 1147.81 |
Low |
1138.41 | 1134.52 | 1139.32 | 1127.70 | |
Close |
1140.50 | 1139.32 | O | 1144.94 | 1129.42 |
% |
-0.7 | -0.1 | +0.5 | -1.4 | |
Range |
9.8 | 14.4 | L | 8 | 20.19 |
% Range |
21 | 33 | 70 | 9 | |
INDU |
10480 | 10442 | I | 10514 | 10381 |
% |
-0.9 | -0.36 | +0.7 | -1.3 | |
Nasdaq |
2050 | 2053 | D | 2063 | 2030 |
% |
-0.5 | +0.1 | +0.5 | -1.7 | |
| QQQ |
36.94 | 36.94 | A | 37.17 | 36.63 |
% |
-0.1 | 0 | +0.6 | -1.4 | |
NYSE |
Y | ||||
T. VOL |
1.45 | 1.19 | 1.10 | 1.42 | |
U. VOL |
485 | 488 | 610 | 153 | |
D. VOL |
942 | 688 | 482 | 1.26 | |
VR |
34 | 41 | 56 | 11 | |
4 MA |
52 | 44 | 42 | 36 | |
5 RSI |
61 | 58 | 67 | 40 | |
ADV |
1611 | 1199 | 1669 | 419 | |
DEC |
1684 | 2042 | 1621 | 2954 | |
A-D |
-73 | -843 | +48 | -2535 | |
4 MA |
-130 | -533 | |||
SECTORS |
|||||
SMH |
-0.2 | +0.4 | +0.6 | -1.2 | |
| BKX |
-0.6 | -0.4 | +0.6 | -2.2 | |
XBD |
-0.3 | -0.4 | +0.6 | -2.8 | |
RTH |
-1.1 | -1.5 | +0.7 | -1.6 | |
CYC |
-1.0 | -0.4 | +0.7 | -2.0 | |
PPH |
-0.3 | -0.6 | +.08 | -0.8 | |
OIH |
+0.8 | +1.1 | +2.3 | -1.7 | |
| BBH |
-1.2 | +1.2 | -0.3 | -1.6 | |
TLT |
-0.2 | -0.3 | -0.4 | -1.1 | |
| XAU |
+0.4 | -1.2 | +0.1 | -6.1 |
^next^
For Active Traders
It was just trend-down after the opening bar
yesterday as price reversed the previous day’s highs and never looked back. The
SPY broke the 114.58 midpoint (4/13 commentary) which also put it below the 240
EMA (5-minute chart) and traded down to a 113.07 low, closing at 113.21. In some
financials like Citigroup
(
C |
Quote |
Chart |
News |
PowerRating)Â there were .50 to .618 retracements back
to the 240-EMAs after the initial 45-minute decline in the SPX, which provided
some short setups and then it was trend-down for the rest of the session.
For Today
The SPX closed in a possible
1,2,3 lower bottom setup on the 5-minute chart if it trades above 1131.70.
If it goes South early and takes out yesterday’s 1127.70 low, then an
RST setup will form which could also be a 1,2,3 lower bottom if it reverses
the 1127.70 low to the upside, provided it doesn’t trade too much below that low
on the initial move. The RST should be your dominant setup. I am doing this very
early Wednesday morning and the futures are not doing much as of 5AM ET.
The SPY closed at 113.21 with the 50-day EMAÂ
at 113.13 and 20-day EMA above at 113.48, so we have an early focus zone to
start the day. For the DIA, which closed at 103.84, there is the 89-day EMA
below at 103.20 and 50-day EMA above at 104.08 and the 20-day EMA at
104.13.
The QQQs closed at 36.63 with the 20, 50 and
89-day EMAs from 36.29 to 36, so that’s the initial price action zone for early
long opportunities. After yesterday’s knife down, the better setups will be
after any early downside follow-through, whether it be rates, INTC or whatever
the flavor of today turns out to be.
Have a good trading day,
Kevin Haggerty


