Are you long energy? Here’s what to do
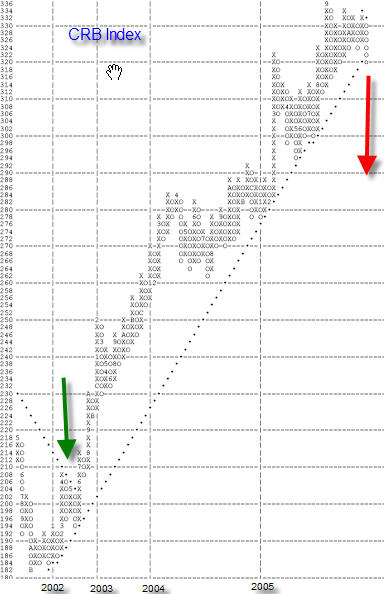
The Reuters Jeffries CRB Index has broken through
its bullish support line on an intraday basis. This breakdown adds insult to
injury due to the fact that the index has also been trading below its 50-day
simple moving average.
The support line that was violated has been in
place since June of 2002; therefore, this break is major. For added
confirmation, conservative traders may like to see a close below the violation
point before acting on the breakdown (a close at 320, and then 318 for added
confirmation). I also see this as a major blow to the energy stocks that I have
been (up until now) quite bullish about.
In addition to this development, the relative
strength chart that I referenced in my last column, of the Morgan Stanley US
Investable Market Energy Index
(
MSCIEN |
Quote |
Chart |
News |
PowerRating) versus the Equal Weighted S&P 500
Index, has rolled to Os, or is now in a declining trend (for those of you
unfamiliar with the point and figure method).
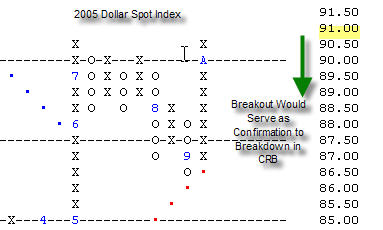
In conjunction with the breakdown in the CRB
Index, we have also seen a rise in the dollar. For those unaware of inter market
relationships, a rising dollar is generally deflationary. The dollar is now at a
similar point of resistance as it was in July of this year. If the dollar spot
index can break to $91.00, that will be an added confirmation that the “bloom is
off the rose†for commodities.
What should you do? If you haven’t sold any of your oil stocks, evaluate which
ones to sell. I wouldn’t sell all of your holdings in the sector, but reduce
exposure significantly. I do not recommend any additional purchases in that
sector at this time either.
As for stocks in the metals sector, I recommend
also evaluating those on a case-by-case basis to determine future price
appreciation or depreciation as the case may be. For stock investors, what could
be a good strategy for those funds that were formally invested in energy or
metal type stocks? At this very moment, I am recommending cash. Until we can get
some leadership from any one particular sector, cash should be fine to hold.
In thinking about leadership, gold has been
strong on a technical basis. However, I do not recommend overweighting the
sector due to the fact that gold normally moves opposite the dollar and WITH
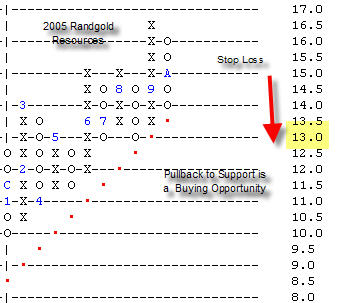
commodities (it is one, after all). If you don’t have any exposure, you could
purchase a small piece of Randgold Resources Limited
(
GOLD |
Quote |
Chart |
News |
PowerRating). The stock has
pulled right back to support and is very close to its stop at $12.50. This trade
would again be for aggressive investors as its momentum is negative and it is
trading below its 50-day simple moving average. More conservative investors
could wait for a close above the 50-day simple moving average and a turn to
positive on momentum. If you have gold exposure, just sit on the sidelines here
with your cash until we can get some more clearly defined and broader based
leadership.
Sara Conway is a
registered representative at a well-known national firm. Her duties
involve managing money for affluent individuals on a discretionary basis.
Currently, she manages about $150 million using various tools of technical
analysis. Mrs. Conway is pursuing her Chartered Market Technician (CMT)
designation and is in the final leg of that pursuit. She uses the Point and
Figure Method as the basis for most of her investment and trading decisions, and
invests based on mostly intermediate and long-term trends. Mrs. Conway
graduated magna cum laude from East Carolina University with a BSBA in finance.