At Quarter End, Here’s What I’m Looking At
What Monday’s Action Tells You
The major indices rebounded as the third quarter
winds down and the five-day condition was oversold, so any reflex is more
expected than a surprise. It was a price increase day without a significant
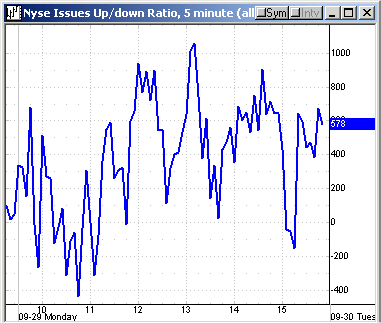
volume increase, as NYSE volume was 1.2 billion, the volume ratio was 69, and
breadth also positive at +1102. The Generals didn’t rush in to buy the level
like there would never be another down day, but nevertheless, it was enough to
be another excellent day for traders that had the correct trading plan. The SPX
(
$SPX.X |
Quote |
Chart |
News |
PowerRating) closed at 1006.59, +1.0%, the Dow
(
$INDU |
Quote |
Chart |
News |
PowerRating) 9380, +0.7%, the
Nasdaq
(
$COMPQ |
Quote |
Chart |
News |
PowerRating) at 1825, +1.8%, and
(
QQQ |
Quote |
Chart |
News |
PowerRating)s at 33.14, +1.8%. Our
primary focus, which is the semis, advanced with the
(
SMH |
Quote |
Chart |
News |
PowerRating) +2.3%.
The major sectors were in line with the major
indices, led by they
(
OIH |
Quote |
Chart |
News |
PowerRating) +1.1% and BKX +1.0%. The only red sector was the
RTH, -0.4%, which closed at 85.90 after having taken out the 85.60 level
mentioned in yesterday’s commentary about the 1,2,3 lower top. The RTH traded
down to 84.82 before reversing to close at 85.90. The volume increased to 1.5
million shares vs. the 485,000 average daily volume The 50-day EMA is 86.40.
Retail stocks like
(
KSS |
Quote |
Chart |
News |
PowerRating),
(
ANF |
Quote |
Chart |
News |
PowerRating) and
(
JNY |
Quote |
Chart |
News |
PowerRating) are all trading below
their 200-day moving averages. The
(
DIA |
Quote |
Chart |
News |
PowerRating)s,
(
SPY |
Quote |
Chart |
News |
PowerRating)s and SMHs all traded
just above their average volume, while the QQQs traded 95 million vs. their 64
million average.
For Active Traders
There were some excellent trade opportunities
yesterday across the board which were set up after the early rally in the
futures dissipated at 9:45 a.m. ET, and the SPX and Dow traded down and took out
the previous day’s lows. This set up RST buy patterns for the SPY/futures, DIAs
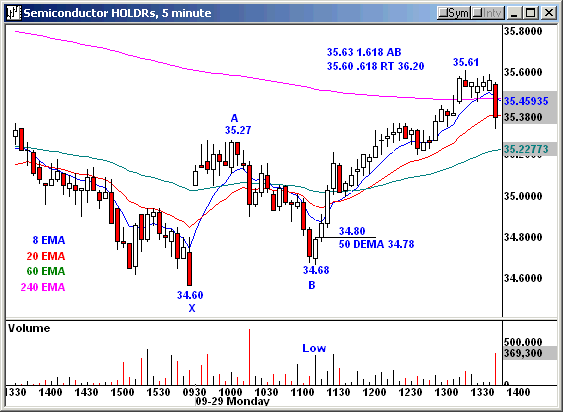
and QQQs. After an early rally, the SMH declined from a 35.27 early high to an
intraday low of 34.68 vs. Friday’s 34.60 low. This was a positive divergence for
the major indices, and they, of course, made the strongest move.
I have included charts of the SMH and SPY in
today’s commentary which I try to do on a regular basis, as it is an extension
of the seminar/module materials which further enhance your education and
understanding.
Looking at the SMH chart, you see that after a
35.27 early high, the SMH traded below its 50-day EMA of 34.78, giving you a
signal bar low of 34.68 and entry above 34.80 which also re-crossed the 50-day
EMA to the upside. The trade ran +2.3% from entry to the initial confluence of
resistance and made a 35.61 intraday high. 35.63 is the 1.618 Fib extension of
the AB leg from 35.27 – 34.68, and 35.60 is the .618 retracement to Thursday’s
36.20 trading high, which was a trade that ran +2.5% from entry on an RST. There
was a delay in posting all of yesterday’s charts, so review Monday’s commentary
as they are now all posted correctly. After making a 35.61 high, the SMH faded
to 35.20, closing at 35.41, +2.3% on the day.
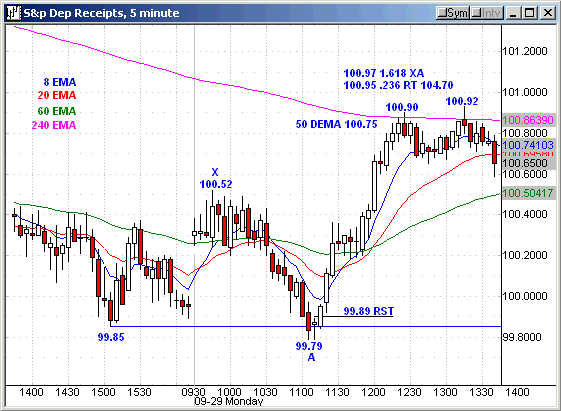
The other chart shows the SPY making a doji
signal bar low of 99.79 on the same 11:10 a.m. bar as the SMH. It reversed the
previous day’s 99.85 low, which was reason enough to take the long entry. And
for those of you that have learned the powerful RST reversal pattern taught in
the seminar material, you got the RST entry above 99.89. The trade ran to a
confluence of resistance and went sideways for the rest of the day, closing at
100.90 (all of the chart not shown).
After yesterday’s market action, there are daily
chart setups for the SPY, DIA, QQQs and SMHs, all of which closed at or just
above their 50-day EMAs on outside-bar closes in the top of the range. The QQQs
closed on the third highest positive volume day since July 1. The SMHs made a
low of 34.60 on Friday, which was right at the confluence mentioned in previous
commentary and closed at 35.41 in the top of the range yesterday on a
change-in-direction bar. They continue to be a primary focus as we have already
made two good trades from the expected confluence zone.
From a longer-term perspective, the SPY 12-month
EMA is 96.55 and rising, while the SPX’s is 962.16. That is also the neckline
for the longer-term resistance from 1998 low. Just in case you are in la la
land, wake up, because there will be a retracement to the 12-month EMA at some
point, just as there was five to six times during the bull run from 1995 when
the Republicans took over control of Congress and the four to five times during
the current bear market. That level was just 4.6% from yesterday’s 1006.59
close.
An early read on a retracement would be the SPX
trading below the August mid-point low of 985.92. There has been essentially no
real retracement since the move to 1040.29 from 788.90. Perception has obviously
gotten way out in front of reality, and it is very important to learn how to
protect significant gains when you have them. The daily market noise should be
put in context with the monthly and weekly charts, and you will avoid the
whipsaws of the daily noise.
Today’s Action
The major indices are at an excellent level for
traders because it is what I call a Trader’s Straddle. By that I mean, for
example, the SPY closed at 100.88, just above the 50-day EMA of 100.84 and
yesterday’s low of 99.79. Yesterday’s continuation high is 101 should the
Generals push price into quarter’s end today. The first downside pivot would be
the 50-day EMA, but if the early red futures hold, we will be looking for Trap
Doors. The Dow futures are -25, Nasdaq -6, and S&P futures -4 as I do this at
7:00 a.m. ET.
Have a good trading day,
Kevin Haggerty


