Battle Plan Trade of the Week: Counting on the QQQQ
Geithner, Smeithner…For days leading up to the sell-off on Tuesday, we and the short term traders who follow our Daily Battle Plan had been building up short positions in a number of exchange-traded funds.
Did we have any sense that the Geithner Plan would disappoint the markets – at least in the immediate term? No. Tim Geithner was the farthest thing from our minds as we watched ETFs like the QQQQ, the FXI, and the EWZ climb deeper and deeper into overbought territory late last week.
As Larry Connors wrote in this morning’s Market Intelligence Report in the Daily Battle Plan, overbought stocks and ETFs always correct and sell-off eventually. And when those overbought stocks and ETFs are trading below the 200-day moving average, those corrections and sell-offs are all the more likely – and all the more likely to be significant. Tuesday’s 380+ point drop in the Dow, for example, was a perfect example of what happens when markets enter and remain in overbought territory below the 200-day moving average.

Among the trades we took over the past few days was a short trade in a very overbought PowerShares Nasdaq Trust ETF
(
QQQQ |
Quote |
Chart |
News |
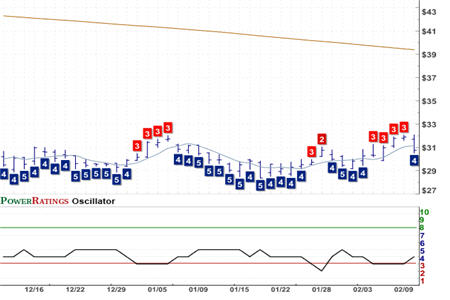
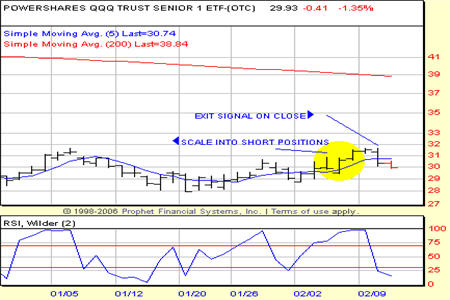
PowerRating). The QQQQ first entered overbought territory on February 3rd and we began adding units short on the following day as the ETF continued to move higher below the 200-day moving average.
One of the strategies that we have championed over the past several months in the Daily Battle Plan is to scale in when taking positions. What I mean by this is that as the QQQQ moved higher and became increasingly overbought, we added units short. To our original short position established on February 4th, we added a second unit on the close of the 5th and a third and final unit on the close of the 6th.
Once fully loaded with three units, our only remaining task was to manage and exit the trade. As always, our exit signal for trades in the Daily Battle Plan relies on the 5-day moving average. Remember that we buy weakness and sell strength. This means that when we are short stocks or ETFs, we are looking to sell (short) strength and buy (or cover) weakness. Using the 5-day moving average as an exit signal, we look to exit short trades when they close below that level.

That close below the 5-day arrived on February 10th, giving us an exit price of approximately 30.34. With short side scale in prices of 29.91, 30.57, and 31.37, two out of the three legs of our short trade were profitable.
Every day in our Battle Plan we’ll provide you with incisive, before-the-bell commentary and analysis on the day’s markets to help put your trading in context. We’ll give you suggested entries and exits for short term trading opportunities in stocks, ETFs and options that may be only hours away. And we’ll give you what many other people can’t: model-driven percentages so that you know the historical win rate going back to 1995 for every single trade idea – long and short
Give the Daily Battle Plan a read before the next market open. Click here to start your subscription or call us today at 888-484-8220.
David Penn is Editor in Chief at TradingMarkets.com.
