Battle Plan Trade of the Week: Why We Rely on the 2-Period RSI
It’s been a relatively quiet week in the TradingMarkets BattlePlan as we spent most of the past week building up positions as the markets moved higher since late November.
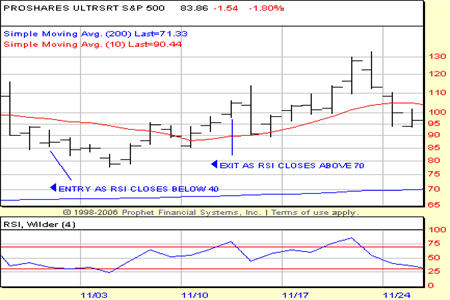
We continue to hold these positions – short trades in exchange-traded funds – and will be looking to exit these trades as fear returns to the markets, driving the prices of stocks and ETFs lower.
What tool will we use to give us our exit signal? What tool will we use to know when fear has truly returned to the markets?
We believe that the 2-period RSI is one of the best indicators for short term traders. A variation on the widely-known, if often misunderstood, Relative Strength Index, Larry Connor’s 2-period RSI, does a much better job in helping short term traders of stocks and ETFs spot instances when traders and investors have become too greedy, driving stocks into short term overbought conditions, or too fearful, sending stocks lower into short term oversold conditions.
This is not just our opinion. Larry’s research on the 2-period RSI is backed up by more than a decade of quantified analysis. While he and his research team have looked at other periods for the RSI (such as 4 periods), the strongest edges – for both stock trading and ETF trading – have been with the 2-period RSI.
ProShares UltraShort S&P 500 ETF
(
SDS |
Quote |
Chart |
News |
PowerRating)

The 2-period RSI is a staple of our analysis, both when it comes to market timing as well as making actual short term trades. Subscribers and traders who use our TradingMarkets BattlePlan to help choose their trades know that the 2-period RSI is a primary tool in determining which stocks and ETFs are on sale, and which stocks and ETFs are being offered at far too high a price.
Being able to buy the former and sell the latter short is the hallmark of our approach to short term trading. The 2-period RSI, perhaps more than any one single indicator, is what helps make this winning approach to short term trading possible.
Here’s a 2-period RSI tip for stock and ETF traders: we found the strongest, short term edges when buying stocks that, while above the 200-day moving average, had 2-period RSIs of less than 2. But when it comes to strong edges and buying ETFs, a 2-period RSI pullback to less than 30 or 40 (in an ETF trading above its 200-day moving average) often signals an oversold opportunity and the potential for upside in the near term.
Want to learn how to trade using the 2-period RSI? Click here to find out what traders are saying about Larry Connors’ new book, Short Term Trading Strategies That Work: A Quantified Guide to Trading Stocks and ETFs!
David Penn is Editor in Chief at TradingMarkets.com.
