Before buying, wait for a close above this red line
Stocks closed the month and the third
quarter on a positive note last Friday, as the
major indices added to their gains from the previous day’s rally. After spending
most of the day in a narrow, sideways consolidation, a wave of buying into the
close pushed the broad market into positive territory. The Nasdaq Composite
(
COMP |
Quote |
Chart |
News |
PowerRating)
again showed the most leadership of the major indices and added another 0.5% to
its prior day’s gain of 1.2%. The S&P 500 eked out a 0.1% gain and the Dow Jones
Industrial Average
(
DJX |
Quote |
Chart |
News |
PowerRating) moved 0.2% higher. The S&P 400 Midcap Index, which
began showing relative weakness in mid-September, gained 0.7%, while the Russell
2000 Smallcap Index
(
RUT |
Quote |
Chart |
News |
PowerRating) advanced 0.4%. Each of the major indices closed at
their intraday highs for the second consecutive day, a positive sign of at least
minor institutional support. Despite its relative strength of the past two days,
the Nasdaq Composite still finished the month of September less than 0.1% lower.
The S&P 500, however, gained 0.7% and the Dow Jones rallied 0.8% for the month.
It was positive that the major indices added on to their gains
from last Thursday’s rally, but the one negative is that stocks did so on
lighter turnover. Total volume in the NYSE declined by 5% last Friday, while
volume in the Nasdaq was 9% lower than the previous day’s level. Volume levels
were below average in both exchanges, but market internals were firmly positive
across the board. Advancing volume exceeded declining volume by a margin of
approximately 2 to 1 in both exchanges.
Tech stocks again comprised the leading industry sectors last
Friday. The Semiconductor Index
(
SOX |
Quote |
Chart |
News |
PowerRating) powered 1.9% higher, bringing its
two-day gain to 3.5%. The Biotech Index
(
BTK |
Quote |
Chart |
News |
PowerRating) similarly gained 1.6%,
although several large-cap Biotech stocks lagged behind the index and held down
(
BBH |
Quote |
Chart |
News |
PowerRating) (Biotech HOLDR). Sector rotation was also prevalent last Friday, as
market leading industries such as Utilities, Oil, and Gold each corrected from
their strong uptrends and record highs.
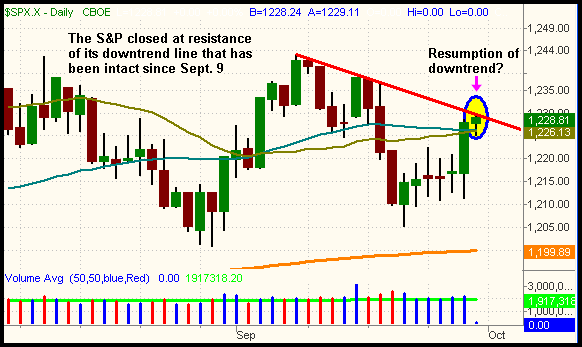
In the September 30 issue of The Wagner Daily, we
pointed out how the S&P 500 had recovered to close above both its 20 and 50-day
moving averages, but was still below resistance of its September downtrend line.
Friday’s session saw a test of both moving averages, which the index again
closed above, but the S&P is now forced to test resistance of that September
downtrend line. It’s bullish that the S&P has held above the 20 and 50-day MAs
for the past two days, but we must assume the current downtrend, which has been
in place since September 9, will remain intact until the index proves otherwise.
Even if the S&P rallies above the September downtrend line, it will need to
contend with a lot of overhead supply from late July and early August:

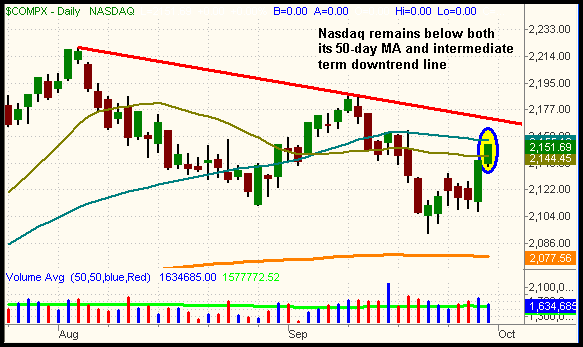
As for the Nasdaq Composite, it will likely test resistance of
its 50-day MA in the coming days, but remember that its downtrend line from the
August high is just above that 50-day MA. A rise in volume and broad-based
momentum will be necessary in order to power the index above those resistance
levels:

Resistance of the downtrend lines on both the S&P and Nasdaq
mean that caution is still required on the long side of the market. Many
industry sectors are showing signs of exhaustion as well, so we feel it is risky
to begin buying aggressively just because the S&P has bounced back above its 20
and 50-day MAs. Our short-term broad market bias has become neutral, as we feel
being positioned largely in cash is the best play right now.
Because we just finished the month of September, it’s a good
idea to take an updated look at the longer-term monthly charts of the major
indices. Looking at the monthly chart, you will see the S&P 500 has spent the
past three months just below resistance of its 61.8%
Fibonacci retracement
level from its high of March 2000 down to the low of October 2002:

As you may know, the 61.8% Fibo level is generally considered
to be the last major resistance level that an index encounters when retracing
against the direction of the primary trend. If the downtrend that began in 2000
is to resume, it will likely do it from here. Therefore, we strongly feel the
S&P 500 is at a critical juncture that will determine its trend for at least the
next year. If the S&P can form a monthly close above its 61.8% retracement
level, above 1,245, it will be quite bullish. However, the current level could
just as easily mark the high of a bear market bounce that began with the bear
market of 2000. Such a situation would likely result in new lows being set
within the next one to two years. Monthly charts obviously present too long of a
timeframe on which to base your short-term trading decisions, but they help you
to keep perspective of the big picture. This, in turn, helps you to keep a clear
head and prevents you from becoming too biased on either side of the market.
Open ETF positions:
Long GLD (regular subscribers to
The Wagner Daily receive detailed stop and target prices on open
positions and detailed setup information on new ETF trade entry prices. Intraday
e-mail alerts are also sent as needed.)
Deron Wagner is the head trader of Morpheus Capital
Hedge Fund and founder of Morpheus Trading Group (morpheustrading.com),
which he launched in 2001. Wagner appears on his best-selling video, Sector
Trading Strategies (Marketplace Books, June 2002), and is co-author of both The
Long-Term Day Trader (Career Press, April 2000) and The After-Hours Trader
(McGraw Hill, August 2000). Past television appearances include CNBC, ABC, and
Yahoo! FinanceVision. He is also a frequent guest speaker at various trading and
financial conferences around the world. For a free trial to the full version of
The Wagner Daily or to learn about Deron’s other services, visit
morpheustrading.com or send an e-mail
to
deron@morpheustrading.com .
