Being Where The Action Is
The
volatility was back yesterday, although only in pockets. The morning
session was dominated by a long steady grind up, with the afternoon offering a
bit of a breakdown through support at 1135, only to close back through it, but
just shy of the highs. For the most part it appeared that once again the mighty
(
$SOX.X |
Quote |
Chart |
News |
PowerRating) was the catalyst as it bounced off its 20-day moving average and
managed a hefty close of +15 points (+2.7%) just below its 200-day moving
average of 568.71. Given this technical snapshot it would appear that the SOX
will remain in play and dictate market action. There were some other plays in
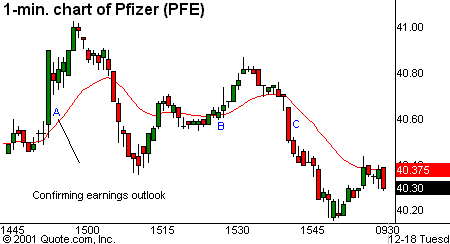
the energy and drug sector. Pfizer
(
PFE |
Quote |
Chart |
News |
PowerRating) offered some great intraday
setups on the heels of them reaffirming profit their outlook, see 1-minute chart
below, points A, B & C.

So again it boils down to a game of
being where the action is if you are trading off of 1-minute bars, or extending
your time frame by going to 5-minute bars and simply trading the technical
pattern without a lot of regard to the overall activity in the stock. A
combination of the two approaches is working well in the current environment.
Bear in mind that with the holidays approaching and it being option-expiration
week, activity may be muted, although a handful of economic reports due out this
week will certainly add pockets of volatility that any nimble trader will be
able to seize upon.
Given that the overall direction is
tough to gauge right now in the market, since it appears to go from unbridled
bullishness to being on the brink of a good size sell-off, I will highlight a
few stocks which exhibit both "bullish" and "bearish"
patterns. I am a firm believer in positioning my longer-term trades with the
overall market direction. At the present time, I hold a handful on both sides of
the market, an indication that I have no solid conviction either way. You can
decide which ones to play based on your thoughts on where the market will go
next.
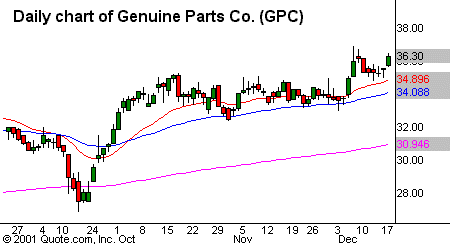
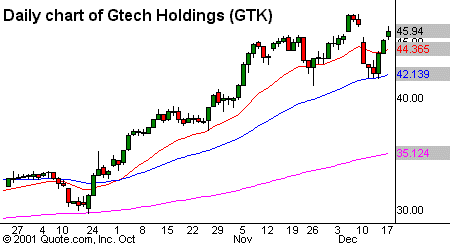
Bullish Patterns:
Genuine Parts Company
(
GPC |
Quote |
Chart |
News |
PowerRating):

Gtech Holdings
(
GTK |
Quote |
Chart |
News |
PowerRating):

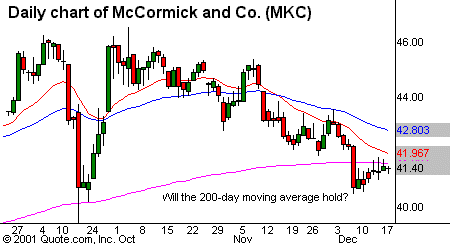
Bearish Patterns:
McCormick & Co.
(
MKC |
Quote |
Chart |
News |
PowerRating):

Key
Technical Numbers (KTNs)
| S&P’s |
Nasdaq |
| 1186 |
1712 |
| 1165.4 |
1690-92 |
| 1152-53 (confluence) |
1680 |
| 1149 | 1654-57 |
| 1142 |
1635-40 |
| 1138 | 1624 (key) |
| 1134 (confluence) |
1618 |
| 1129 |
1582 (key) |
| 1121 | 1566-68 |
| 1115 | 1560 |
| 1108.2 |
Over the last several months I
frequently get emails asking how to trade with the KTNs. It is easy
to forget that a tool that I have been using for several years and is second
nature for me, may not be real obvious to newer traders, or traders who
traditionally have not traded intraday. While I cannot possibly do the whole
process justice in just one column, I at least wanted to let you know that I am
working on a comprehensive piece that will be completed sometime in early 2002.
In the meantime, let me just refresh
your memory. I primarily use the KTNs as potential support/resistance in the
futures. In essence, what this allows me to do is identify potential areas where
I may wish to establish a long/short position. Or, more importantly, when not
to take a trade simply because we have a large resistance/support area close by.
Go back and look at yesterday’s one and five minute chart of the S&P
futures, notice where several of the consolidation and breakout areas occur,
several match the KTNs featured in yesterday’s
piece.
Make no mistake, it is not a
mechanical system, there is a certain degree of "feel" and
"art" to using them. With time however, you will find them an
immensely helpful tool for intraday trading.
As always, feel free to send me your
comments and questions. See you in TradersWire.
