Blow-Off Tops In These Areas?
The major indexes were able to rebound from sharp
declines on Tuesday to finish the week slightly higher. On Tuesday,
equities and equity futures were sold with a vengeance due to news that South
Korea would look to diversify away from their large U.S. Dollar holdings.Â
However, before Wednesday’s session began, central banks of Japan, Taiwan and
South Korea all came out and said they had not sold any dollars. They also
calmed the markets by saying that they had no plans to do so. At the time, this
was not regarded as big news, but it did go a long way towards calming worries
of a nightmare scenario of U.S. debt being sold. The remainder of the week of
trading was marked with a clear upside bias, despite Crude Oil staying over $50
per barrel and mediocre economic data. Leaders for the week were Oil,
Homebuilding and Industrial Metal shares, while Financial names lagged. Overall
breadth also did improve, after showing relative weakness so far for much of
2005.
The March
SP 500 futures closed out the week with a gain of +9.75 points, while the Dow
added +45 points. Looking at the weekly chart, the ES posted a hanging man, but
was able to hold its 10-week MA. On a daily basis, the ES closed back above its
10-day MA, but ran into resistance at the previous week’s high. The YM also
posted a weekly hanging man above its 10-week MA, and needs to break the
previous week’s high to confirm its weekly and daily Cup and Handle patterns.Â
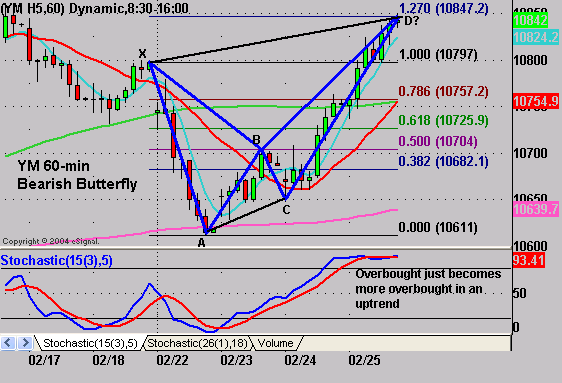
On an intraday basis, the 60-min and 30-min bearish Gartleys couldn’t confirm,
and are now forming bearish Butterfly patterns. For you daily 3-Line Break
followers, the ES and YM broke long again with new Break Prices of 1184.75 and
10618 respectively.
Â
               
Â
As of
Friday’s close, the Dow was able to post a new closing high for 2005. The Dow’s
(INDU) strength has been spurred by stocks such as Exxon Mobil (XOM), which
recently surpassed General Electric as the largest company on the planet in
terms of market capitalization. In fact, on Friday alone, Exxon added more than
$15 billion in market cap, which is a pretty dramatic move for such a large
company. In fact, it posted so much of a move that the stock’s chart looks like
a blow-off move to the upside. And XOM is not alone, as shares of other
industrial names also appear to be posting their own blow-off tops. What we
have witnessed may very well be a classic upside panic to own these shares by
fund managers under-exposed to those groups. However, even though those sectors
could remain secular bull stories, they look very close to seeing cyclical
tops.Â
 
Â
Please feel free to email me with any questions
you might have, and have a great trading week!
Â
Â
Â
Â
