Bollinger Band Models Suggest Indecision
Dancing and prancing around the charts, I was noticing comments from a lot of my traders saying they were having a hard time reading the markets as the moves were choppy.
I pulled up my Bollinger Models on the daily charts to take a look at where prices were posting up lately. The answer quickly became obvious. The market is in a state of indecision and standing over a precipice. Everything suggests traders are considering two major options at this moment:
1) Do we continue these massive downtrends and strengthen the USD or
2) Do we dare attempt a long needed reversal?
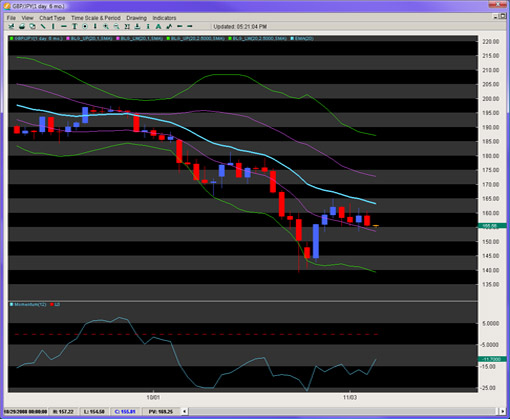
The charts, which suggest this contemplation is within traders, is my steady Bollinger Models. Looking at the chart below, you will see the daily chart of the EUR/USD and GBP/JPY. They are comprised of two sets of Bollinger Bands, one set at 1 Standard Deviation and one set at a 2.5 STD. There is also a blue line which is a 20EMA. The spaces between them generally paint a picture as to where the order flow is skewed. If the bands themselves are horizontal, the bias is clearly mixed with no clear winner in the order flow. However, when they are angled (either up or down), they suggest not only the bias, but how strong the bias and order flow behind it is.
Figure 1: EUR/USD Chart
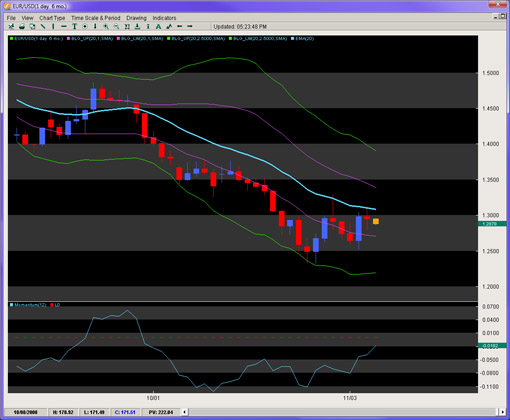
Figure 2: GBP/JPY Chart
When the price action is between the 1 and 2.5 STD, if the bands are angled at a 30 degree (up or down angle) or greater, the order flow behind such moves is usually quite strong and represents an acceleration of order flow piling in that direction. We are talking order books of 70% and above in one clear direction.
However, when the price action is spending a fair amount of time within, what I call, the ‘Neutral Zone’ (forgive me – I’m a Star Trek fan), then the order flow is more mixed, akin to a 60/40 or 55/45 scenario. With books like that, you have a harder time dominating the direction for the pair, and thus the price action gets choppier.
Almost every major pair and cross are within this environment, and when this happens, swing trading or targets beyond 100/150 pips become tougher to achieve. Thus, we recommend shortening your targets and switching to your more accurate/less active systems or smaller target systems.
We do feel it’s important to note how Momentum models on all the Daily charts are suggesting the majors and JPY crosses are making a legitimate attempt at a sincere reversal. Many of them are either attacking the 20EMA or have breached it ever so slightly. After long trends, breaches of the 20EMA often become legitimate reversals and go for Fibonacci and opposite bands. We are not there yet but the case being made for the reversal players is definitely being noticed.
Even though the bias is down, sell cautiously.
Chris Capre is the Founder of Second Skies LLC which specializes in Trading Systems, Private Mentoring and Advisory services. He has worked for one of the largest retail brokers in the FX market (FXCM) and is now the Fund Manager for White Knight Investments (www.whiteknightfxi.com/index.html). For more information about his services or his company, visit www.2ndskies.com.