Bookies One For One
The
bookies were right, as a well telegraphed and
tradable program rally from about 2:45 p.m. into the bell enabled the Nasdaq 100
(
NDX |
Quote |
Chart |
News |
PowerRating), S&P 500
(
SPX |
Quote |
Chart |
News |
PowerRating) and Dow to all finish slightly positive on the day.
Total volume was 1.131 billion shares with a volume ratio of 61 and advancers
over decliners by +250.
The NDX closed at 1927.69
which is still below the 1982 top of its sideways range but only 1 3/8 points
away using the QQQs. The SPX closed at 1292.96, just below the 1305-1307
resistance and at the down trendline level. It remains to be seen whether the
trading range becomes a base for an accelerated move through the resistance
before a pullback, or if we get a retracement from the resistance. This
week is a time zone and the NDX trading range should get resolved.
I have included the
5-minute charts of the NDX, SPX and NYSE ticks to highlight the trade logic that
preceded the expiration program rally. Looking at the NDX chart, you can see
that it trended down from the contra rally top on the 10:10 a.m. bar until it
broke the down trendline about 2:05 p.m., formed swingpoint 2, then retraced
.786 to the previous swingpoint 1 low. It
was a five-bar pullback from the close in the top of the range on the setup bar.
Your entry was above the high of the setup bar for a basic 1,2,3 higher bottom
entry which was confirmed by the 8(3)(3) stochastics.Â
You will see that the NDX
was positively diverging from the SPX. The SPX made a 1,2,3 lower bottom after
breaking the downtrendline, providing entry above the setup bar high of 1281.84.
It closed at 1291.96. When the SPX made a lower bottom, the NDX was making a
higher one. That divergence was positive — but the primary positive divergence
is demonstrated on the NYSE tick chart.Â
From just after 1:00 p.m.,
the NYSE ticks started to positively diverge, with higher lows as I have marked
on the chart. Also, as NYSE ticks had showed positive divergence, so did the
8(3)(3) slow stochastics. Summed up, the NDX had a positive divergence, NYSE
stock exchange ticks and the 8(3)(3) slow stochastic also showed positive
divergence as the SPX gave you a clearly defined 1,2,3 lower bottom setup.Â
Add in the fact that you
knew it was expiration Friday, so the sum of the parts all added up to a good
trade.
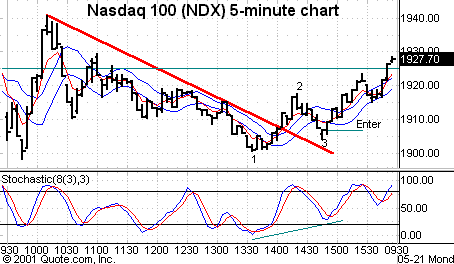
Chart
1. Five-minute chart of Friday’s
(
NDX |
Quote |
Chart |
News |
PowerRating)
with 8-period (high and low) SMAs and 5-period
EMA.
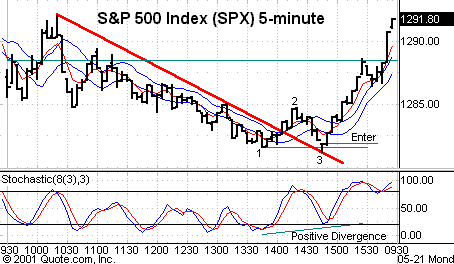
Chart 2. Five-minute chart of
Friday’s S&P 500
(
SPX |
Quote |
Chart |
News |
PowerRating)
with 8-period (high and low) SMAs and 5-period
EMA.
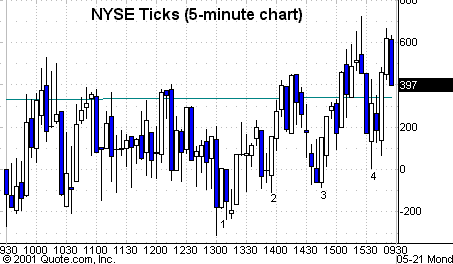
Chart
3. Five-minute chart of Friday’s NYSE Ticks.
For those of you who
attended the seminar, you should see that the RST entry was the same as the
1,2,3 lower bottom entry which was even more confirmation. Post-expiration and
after the recent rally, the Generals must prove that they don’t want this rally
to retrace just yet. As traders, you have the privilege to just keep riding the
train on an intraday basis. If you are a position trader carrying profitable
positions, don’t hesitate to take some money off the table by selling a
percentage of your position into strength, or protecting it with puts.
Stocks
Today
|
(June
|
||
|
Fair Value
|
Buy
|
Sell
|
|
2.80
|
4.05 |
1.50
|
Biotechs like
(
IDPH |
Quote |
Chart |
News |
PowerRating),
(
HGSI |
Quote |
Chart |
News |
PowerRating) and
(
PDLI |
Quote |
Chart |
News |
PowerRating) have come out of the top of consolidations right at
their 200-day EMAs and above all of their 10-, 20- and 50-day EMAs. This is one
of the key spots the Generals like to accelerate their positions. Keep them on
their radar.
Other stocks:
(
CCU |
Quote |
Chart |
News |
PowerRating),
(
SAFC |
Quote |
Chart |
News |
PowerRating),
(
C |
Quote |
Chart |
News |
PowerRating),
(
LEH |
Quote |
Chart |
News |
PowerRating),
(
BRCM |
Quote |
Chart |
News |
PowerRating),
(
AMD |
Quote |
Chart |
News |
PowerRating),
(
IDTI |
Quote |
Chart |
News |
PowerRating),
(
LRCX |
Quote |
Chart |
News |
PowerRating),
(
KLAC |
Quote |
Chart |
News |
PowerRating)
and
(
NVLS |
Quote |
Chart |
News |
PowerRating).
If you’re going to play an
(
NVDA |
Quote |
Chart |
News |
PowerRating), beware that there’s earnings due today.Â
Also, take a look at
(
WAG |
Quote |
Chart |
News |
PowerRating),
(
CBS |
Quote |
Chart |
News |
PowerRating),
(
CEFT |
Quote |
Chart |
News |
PowerRating),
(
CTAS |
Quote |
Chart |
News |
PowerRating),
(
VRSN |
Quote |
Chart |
News |
PowerRating),
(
ITWO |
Quote |
Chart |
News |
PowerRating) and
(
VRTS |
Quote |
Chart |
News |
PowerRating).
Be aware of the bias today
— 60/40 against, so we’ll give the bookies their due. They came through on
Friday so we have to be aware of whether or not they come through today.
Have a good trading day.