Break this level and it’s ‘hello, August lows!’
Stock index futures opened
Tuesday’s session with a bounce from Tuesday’s slide after crude oil took a
right turn to the downside and ahead of a speculative 10th rate hike by the FOMC.
After a strong consolidation for the first hour, the buy programs kicked in and
broke the SPoos through the overnight high for a test of Monday’s session high.
After the Fed hiked rates for the 10th time, pushing the Fed Funds rate to its
highest since June 2001, and left its previous policy bias intact, we saw a
“sell the news” reaction. The programs hit on both ends of the spectrum as
we saw a quick sell-off, followed by a bounce, and then a resumption to new
lows.
The
December SP 500 futures closed Tuesday’s session with a loss of —10.50 points,
while the Dow futures posted a slightly smaller relative loss of -82 points.
Looking at the daily charts, both the ES and YM posted wide-range down candles
with the ES settling right at its 20-day MA and the YM resting on its 100-day
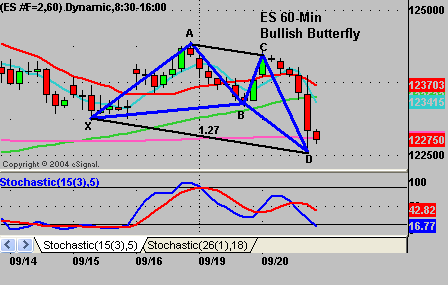
MA. A break of those levels and it will be “hello, August lows!” On
an intraday basis, both contracts have completed 60-min, 30-min, and 13-min
bullish Butterfly patterns. For you daily 3-Line Break followers, the ES
remains long with a Break Price of 1221.75, while the YM is still long with a
Break Price of 10480.

Trade Execution (The Big Picture)
Trade execution is more than simply buying or selling. It is the entire
process of executing the procedures outlined by your trading plan. The trader
who follows a set of pre-planned set-ups and procedures during the trading day
has many advantages over the trader who “shoots from the hip.”
First, pre-planned set-ups help to foster a comfort level and relaxed mindset
very unlike that of a trader who attempts to trade by feel, or by responding to
market news, or by using the “latest and greatest” indicators. A trader with a
set of pre-planned and tested set-ups doesn’t need to contemplate what the
market is going to do next, but rather simply responds to what the market does.
In other words, with a plan, you won’t second-guess your trading decisions, and
all you have to do is follow your rules.
After the close, you can review your trades and determine how effective you
are at following your own plan. In effect, you are acting as the boss and
managing the trader which, in this case, is yourself. It may be that in
real-time, you don’t have the patience to wait for exit signals. If that is the
case, then you can review the historical trade data and determine the difference
that would result if you were to use acceptable preset reward targets compared
to your risk. You would not be able to do this if all of your exits were based
on a second-to-second decision process. You would not know what to fix, because
it would be pretty much impossible to even determine the problem.
Finally, if your real-time trading results do not approach your hypothetical
results, then you have the data necessary to determine if it is the approach
that needs modification, if the market conditions have changed, or if you simply
are not following your own trading plan effectively. Will this happen overnight?
Heck, no! It can take a couple years just to figure out what fits with
your personality and risk tolerance.
Daily Pivot Points for 9-21-05
| Symbol | Pivot | R1 | R2 | R3 | S1 | S2 | S3 |
| INDU | 10517.80 | 10568.48 | 10655.45 | 10706.13 | 10430.83 | 10380.15 | 10293.18 |
| SPX | 1225.97 | 1231.86 | 1242.39 | 1248.28 | 1215.44 | 1209.55 | 1199.02 |
| ES Z5 | 1232.00 | 1238.50 | 1249.50 | 1256.00 | 1221.00 | 1214.50 | 1203.50 |
| SP Z5 | 1232.00 | 1238.40 | 1249.20 | 1255.60 | 1221.20 | 1214.80 | 1204.00 |
| YM Z5 | 10559.33 | 10612.67 | 10700.33 | 10753.67 | 10471.67 | 10418.33 | 10330.67 |
| BKX | 98.19 | 98.80 | 99.86 | 100.47 | 97.13 | 96.52 | 95.46 |
| SOX | 468.79 | 471.65 | 477.04 | 479.90 | 463.40 | 460.54 | 455.15 |
Weekly Pivot Points for Week of 9-19-05
| Symbol | Pivot | R1 | R2 | R3 | S1 | S2 | S3 |
| INDU | 10621.56 | 10722.19 | 10802.44 | 10903.07 | 10541.31 | 10440.68 | 10360.43 |
| SPX | 1235.12 | 1245.39 | 1252.87 | 1263.14 | 1227.64 | 1217.37 | 1209.89 |
| ES Z5 | 1241.33 | 1251.92 | 1261.58 | 1272.17 | 1231.67 | 1221.08 | 1211.42 |
| SP Z5 | 1240.70 | 1250.70 | 1259.10 | 1269.10 | 1232.30 | 1222.30 | 1213.90 |
| YM Z5 | 10658.33 | 10756.67 | 10840.33 | 10938.67 | 10574.67 | 10476.33 | 10392.67 |
| BKX | 98.60 | 100.00 | 100.67 | 102.07 | 97.93 | 96.53 | 95.86 |
| SOX | 476.53 | 483.84 | 492.91 | 500.22 | 467.46 | 460.15 | 451.08 |
Please feel free to email me with any questions
you might have, and have a great trading week!
Chris Curran
Chris Curran started his trading career at the
age of 22 with a national brokerage firm. He combines fundamentals and
technicals to get the big picture on the market. Chris has been trading for 15
years, starting full time in 1997, and has never had a losing year as a
full-time trader.
