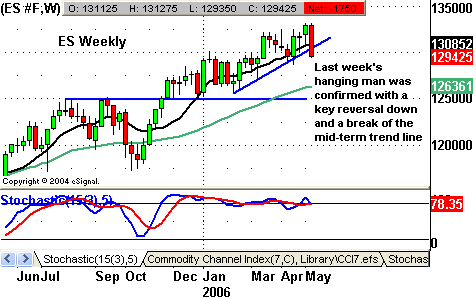
Bull market correction or new bear market?
It was an ugly week for the equities markets, largely
due to uncertainty over Wednesday’s Fed comments. During the first 3
sessions of the week, more of what we saw in previous weeks took place, with
money leaving the Tech sector and finding its way into blue chip shares.
However, every sector was sold in an aggressive manner on both Thursday and
Friday. There didn’t seem to be much to the selling, beyond concerns over
inflation and the possibility of a more hawkish Fed. More than likely, large
asset allocators were shifting money from stocks to bonds in order to capture
higher, risk-free yields. Sell programs, which sell stocks with little regard
to price (i.e. it’s all computer driven), were running rampant throughout those
2 days. Overall, it was a bearish way to end a week that started with so much
optimism over the Fed pausing.
Given the
severity of the declines over the past 2 sessions, the question most traders are
now probably asking is whether this is the start of a serious decline, or a mere
correction in the midst of a bull market. Because this bull market is now
mature in terms of duration, it would be normal to experience some sort of a
bear market at this stage. This doesn’t mean a decline as severe as 2000-2002,
as that was likely a once in a generation type bear market. However, given how
far along the Fed is in its tightening cycle, it’s always possible that we could
be nearing a medium-term market top. Additionally, recent fundamental data and
the recent price action in the tech sector could both be the writing on the wall
for the end of a bull market cycle.
It’s
important to remember that a 5%-10% correction in the S&P 500 is normal and
often times necessary to restore the overall health of the market. Also, the
best trading opportunities, both long and short, often arise during market
corrections. This is because volatility almost always increases during market
declines. For those who are nimble, the next several weeks could end up being
one of the better opportunities to make money with regard to intraday trading.
As far as market direction from a longer-term perspective, it’s best to keep an
eye on market internals. If these deteriorate further in the weeks ahead, it
will likely serve as an early warning sign of a more protracted market decline,
which could last into September/October. It’s also possible that the prior
several days of weakness was nothing more than a much-needed correction. If
that’s the case, it’s very possible that we see a powerful snapback rally
occur. As we all know, the market these days has a short memory at best.

Daily
Pivot Points for 5-15-06
| Symbol | Pivot | R1 | R2 | R3 | S1 | S2 | S3 |
| INDU | 11418.58 | 11462.42 | 11543.85 | 11587.69 | 11337.15 | 11293.31 | 11211.88 |
| SPX | 1295.83 | 1301.29 | 1311.33 | 1316.79 | 1285.79 | 1280.33 | 1270.29 |
| ES M6 | 1300.17 | 1306.83 | 1319.42 | 1326.08 | 1287.58 | 1280.92 | 1268.33 |
| SP M6 | 1298.93 | 1304.37 | 1314.43 | 1319.87 | 1288.87 | 1283.43 | 1273.37 |
| YM M6 | 11453.67 | 11506.33 | 11604.67 | 11657.33 | 11355.33 | 11302.67 | 11204.33 |
| BKX | 110.90 | 111.34 | 112.16 | 112.60 | 110.08 | 109.64 | 108.82 |
| SOX | 494.11 | 497.27 | 502.91 | 506.07 | 488.47 | 485.31 | 479.67 |
Please feel free to email me with any questions
you might have, and have a great trading week!
Chris Curran
Chris Curran started his trading career at the
age of 22 with a national brokerage firm. He combines fundamental and technical
analysis to get the big picture on the market. Chris has been trading for 15
years, starting full time in 1997, and has never had a losing year as a
full-time trader.
