Bullish bias remains, watch these key levels
Monday’s session was a classic creeping
rally. Small caps sold off in the first hour, while big caps held fast.
Everything turned bullish shortly past 10:30am EST. Price action rose in
program-driven spurts, followed by sharp pull backs in some markets and sideways
coiling in others.
Well into the final hour we saw price action
squirt upward to close near session highs. What seemed to be markets rising in
protest much of the day turned into a sneaking trend session higher. Expect to
see much of the same during up days from now thru year’s end, along with
sideways and sharp sell off sessions in between.
ES (+$50 per index point)
S&P 500 was 100% bullish all session on Monday.
After an early lift from pivot support near 1149, we had continuous buy signals
near 1251 ~ 1252 all day lone. I actually bought the index at 1252 before noon
and held that trade for hours on end while the chart chugged sideways in a
paltry little 2pt range. Literally minutes before the 3:40pm EST ramp, I scalped
out for +2pts on a trailed stop at 1254. Next ticks from there began the launch
to 1258+, where I intended to exit in the first place.

Such is how it goes with ascending markets.
They often rise in agony but usually fall with predictable, methodical
precision. It is usually (not always) easier to trade the downside in markets
trending lower, but that’s not what we have going on right now.
ER (+$100 per index point)
Russell 2000 flopped around both sides of the
ledger early on, before flipping bullish near 10:30am est. After that we saw
several pull backs to support, the later ones good for several index points
each. I’ve been working with -$100 per contract initial stops in both the ES and
ER. That range is perfectly fine for swing trading the ES, but too tight for
swing trading the ER. Right now the ER offers +$300 profit moves consistently,
often more. Using -$150 initial stops keeps the risk-reward ratio identical
regardless. The Russell has twice average dollar range than ES most days, but is
considerably more gyrational = volatile. Wider profit targets, wider initial
stops but the 2/1 or better profit – loss ratio remains intact.

This Session:
ES (+$50 per index point)
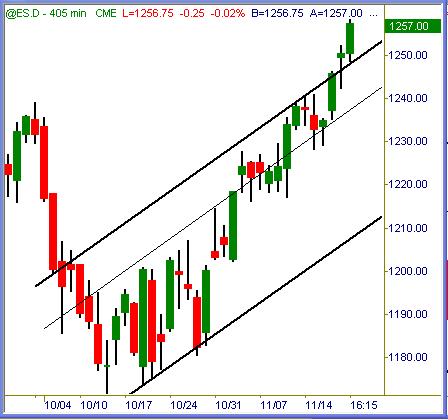
S&Ps are breaking out of the channel resistance
on a confirmed daily close above last Friday, followed by another close higher
on Monday. Just like former resistance turned support at the trendline marked
Monday lows, we should see further bounces off this line hold going forward.

ER (+$100 per index point)
Small caps continue to lag the big cap indexes
in performance, which does thwart the three-year old pattern of small caps
leading large since late 2002. Whatever the case may be and regardless of
intraday behavior, price action continues posting higher highs by each closing
bell.

Summation
The trend bias is decidedly upward for now. That does not mean every
session will be bullish and we must ignore the downside. There will be sessions
that chop sideways in small-range fashion. There will be sessions where sharp
selloffs ratchet down the charts, if only for a little while. We might even see
annual highs reached and pinned a week or two before the new year begins.
Last year’s Thanksgiving week was rife with
sideways, low range price action between the bells. Bias may be upside from now
thru Friday or beyond, but we still need to respect buy or sell signals when
clear, and willingness to stand aside when charts are muddled. Year-end markets
can be more of a challenge to trade, so let’s be careful out there!
Trade To Win
Austin P
(Weekend Outlook trend-view section…
open access)
Austin Passamonte is a full-time
professional trader who specializes in E-mini stock index futures, equity
options and commodity markets.
Mr. Passamonte’s trading approach uses proprietary chart patterns found on an
intraday basis. Austin trades privately in the Finger Lakes region of New York.
