Buy Low, Sell High: Four Oversold Stocks for Traders
When a market dives by more than 350 points, there is a good chance that there will be stocks that are ready to say “enough is enough” and that it is time to move higher soon afterward.
It may sound commonsensical, but if you are in the stock trading game to buy low and sell high, markets that fall has hard as they did yesterday present potentially as many bullish opportunities as bearish ones. As our research has shown, markets and stocks that get hit big have a tendency to be higher in one-day, two-days and one-week later. This is because professional investors and traders look for stocks to move down before they buy them
— in the same way that savvy investors wait for stocks to bounce before shorting them.
Trading this way is essentially a mean reversion method. The implied thinking is that strong stocks will recover from temporary weakness and that weak stocks will give out after showing temporary
strength. The trick to this approach to trading is two-fold: first
traders must be able to tell the difference between strong and weak stocks. Second, traders must have a way to tell when a weak stock is experiencing temporary strength and when a strong stock is experiencing temporary weakness.
To answer the first question, we at TradingMarkets rely on the 200-day moving average. Stocks that are trading above that moving average are, on balance, strong stocks. Those names that are trading below that moving average tend to be weak stocks.
To respond to the second question, we use a variety of techniques
— one of which is the familiar technical indicator, the Relative Strength Index, developed by Welles Wilder decades ago. We modify the Relative Strength Index or RSI so that it focuses only on the most extreme instances of overbought strength of oversold weakness, and have found that our modifications make the RSI one of the most effective short-term technical indicators available.
Specifically, we change the period length of the RSI from the
traditional 14-days to only two days. Also we raise the threshold
for overbought conditions from 70 to 98 and lower the threshold for oversold conditions from 30 to 2. Again, the idea is to only capture those stocks in the most extreme conditions
— which our adjustments to the RSI help us do very well.
Click here
to read our research into trading with the 2-period RSI.
Combining the 200-day moving average with the 2-period RSI helps traders both identify strong stocks, as well as spot when those strong stocks are experiencing temporary weakness by virtue of an extremely low
— below 2 — Relative Strength Index number.
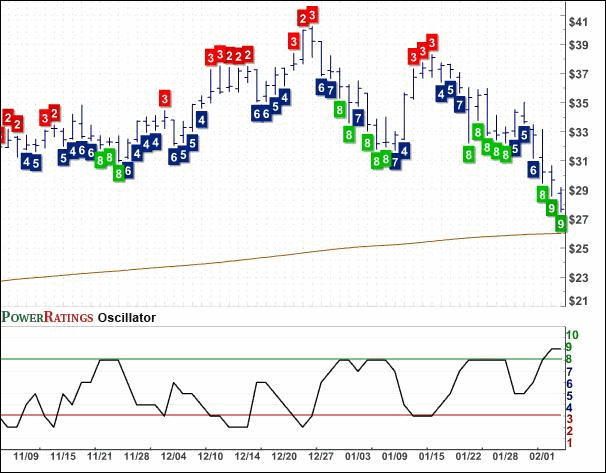
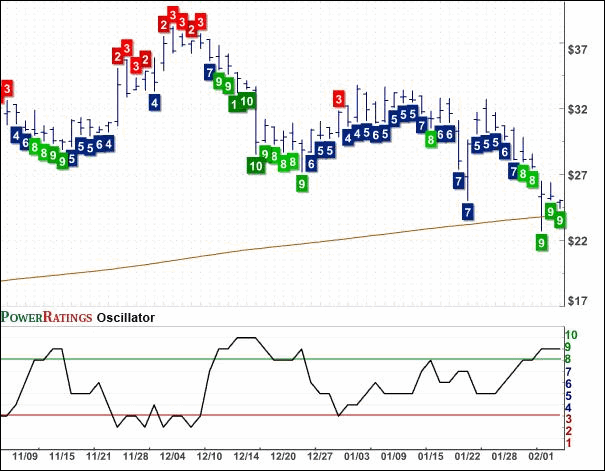
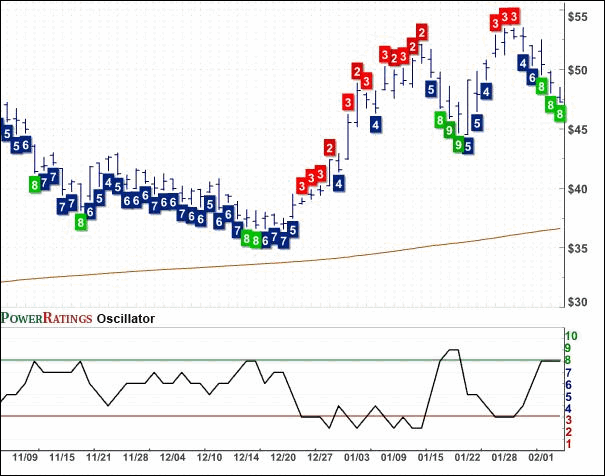
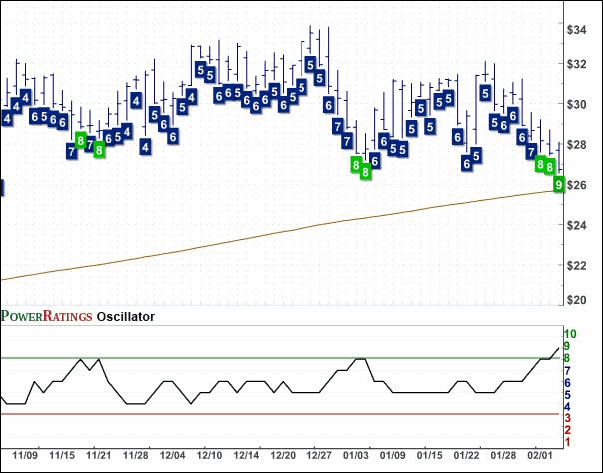
Each of the following four stocks belongs to that group of exceptionally oversold stocks that may be vulnerable to reversal in the near-term. All of the stocks have Short Term PowerRatings of 8 or 9, making them among the best opportunities for traders over the next few days. I have also noted the specific 2-period RSI values so that traders can compare the different stocks based on how oversold they are.
Abaxis Inc. [ABAX@ABAX]. PowerRating 9. RSI(2) 1.50

Stanley Inc. [SXE@SXE]. PowerRating 9. RSI(2) 0.72

Barrick Gold Corp
(
ABX |
Quote |
Chart |
News |
PowerRating). PowerRating 8.
RSI(2) 1.62

Pricesmart
(
PSMT |
Quote |
Chart |
News |
PowerRating). PowerRating 8. RSI(2) 0.96

David Penn is Senior Editor at TradingMarkets.com
