Buy or stay in cash? These 3 charts tell you
The major indices followed up last
Friday’s surge with another day of broad-based gains Monday.
Thanks to momentum from the previous day’s strong close, stocks
began the day with an opening gap up, traded in a tight and narrow range
throughout the afternoon, then rallied during the final ninety minutes. A wave
of selling hit the markets in the last fifteen minutes, but the major indices
retained most of their gains nevertheless. The Nasdaq Composite
(
COMP |
Quote |
Chart |
News |
PowerRating),
which showed relative weakness the prior day, played “catch up” and cruised 1.5%
higher. The S&P 500 gained 0.7% and the Dow Jones 0.4%. Small and mid cap stocks
also soared alongside the Nasdaq, as the Russell 2000
(
RUT |
Quote |
Chart |
News |
PowerRating) advanced 1.8% and
the S&P Midcap 400
(
MDY |
Quote |
Chart |
News |
PowerRating) closed with a 1.6% gain. For the month of October,
the major indices lost the following amounts: Nasdaq Composite (1.4%), S&P 500
(1.8%), and the Dow Jones
(
DJX |
Quote |
Chart |
News |
PowerRating)Â (1.2%). If not for the substantial
gains in the last two trading days of the month, each of those losses would have
been more than doubled.
The most positive thing about Monday’s session is that the
gains occurred on increased turnover in both exchanged. Total volume in the NYSE
was 8% higher, while volume in the Nasdaq increased by 3% over the previous
day’s level. This means that both the S&P and Nasdaq registered bullish
“accumulation days.” Market internals were also bullish, as advancing volume
exceeded declining volume by more than 4 to 1 in the Nasdaq and 3 to 1 in the
NYSE. Since the Nasdaq has now had two consecutive “accumulation days,” it may
be a sign that institutions are beginning to return to the markets. Confirmation
of this would occur if we begin to see declining volume on subsequent down days.
Although the S&P had numerous days in October in which it
trended to more than a 1% gain, yesterday was the first time the broad market
followed through with two consecutive uptrending days. All the other significant
“up” days last month were followed by reversals only one to two days later. The
fact that the major indices managed two straight days of solid gains, combined
with the accumulation days in the Nasdaq, is a positive sign for the bulls.
However, the biggest factor that could put a damper on the bull party is the
simple fact that each of the major indices still remain below resistance of
their intermediate-term downtrend lines. In fact, those downtrend lines acted as
resistance on several of the indices yesterday.
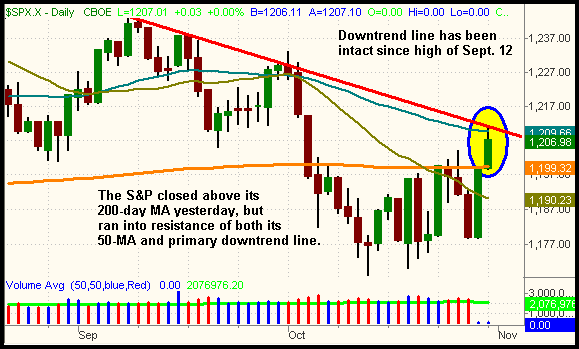
The S&P 500 firmly closed above its 200-day moving average
yesterday, a resistance level that has plagued the index since it first closed
below it on October 5. Obviously, it would be bullish if the index can hold
above the 200-MA for more than a day or two, but both the 50-day MA and the
S&P’s primary downtrend line may create a challenge. Looking at the daily chart
of the S&P below, notice how the S&P 500 ran into resistance of both its 50-MA
and primary downtrend line yesterday:

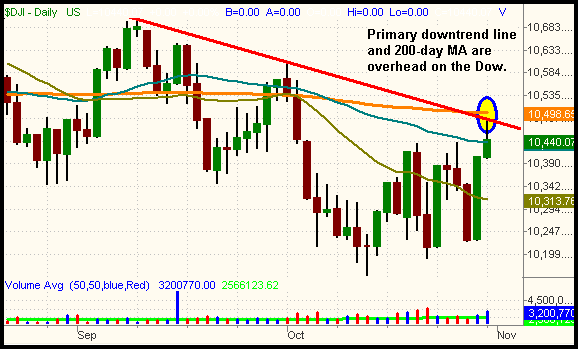
Similarly, the Dow backed off after testing resistance of both
its intermediate-term downtrend line and its 200-day MA, the latter of which it
has been trading below since October 3:

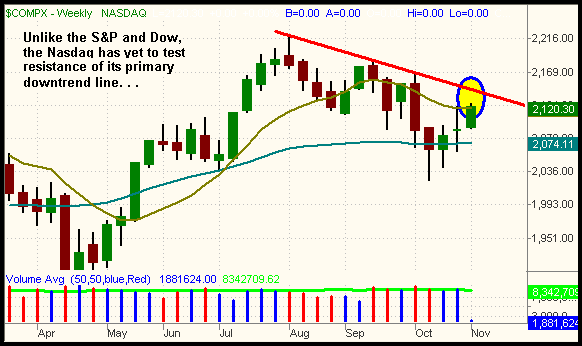
As you may recall, the Nasdaq has been in a primary downtrend
for one month longer than both the S&P and Dow. It also remains well below
resistance of its downtrend line that began with the high of August 3. The
weekly chart of the Nasdaq below illustrates this relative weakness:

As the charts above illustrate, the major indices are key,
pivotal levels right now. Whether or not the S&P, Dow, and Nasdaq can break out
above their primary downtrend lines will be the determining factor for the broad
market’s direction in November. We don’t care which direction the market goes,
as we would simply be happy just to have a steady trend. But until we see a new
uptrend develops or we see resumption of the primary downtrends, we are content
to remain largely positioned in cash.
The Feds meet to discuss monetary policy today and will be
announcing their decision on interest rates at the usual time of 2:15 pm EDT. As
you are probably aware, interest rate announcements are usually followed by
erratic and volatile market action, so you may wish to consider holding off one
more day on any new trade entries. Giving the markets at least a day to digest
the pending Fed comments before entering new trades will lower your risk of
getting whipsawed in both directions. It will also give us more time to see how
the major indices react to resistance of their primary downtrend lines, a test
which is imminent.
Open ETF positions:
We are currently flat. (regular subscribers to
The Wagner Daily receive detailed stop and target prices on open
positions and detailed setup information on new ETF trade entry prices. Intraday
e-mail alerts are also sent as needed.)
Deron Wagner is the head trader of Morpheus Capital
Hedge Fund and founder of Morpheus Trading Group (morpheustrading.com),
which he launched in 2001. Wagner appears on his best-selling video, Sector
Trading Strategies (Marketplace Books, June 2002), and is co-author of both The
Long-Term Day Trader (Career Press, April 2000) and The After-Hours Trader
(McGraw Hill, August 2000). Past television appearances include CNBC, ABC, and
Yahoo! FinanceVision. He is also a frequent guest speaker at various trading and
financial conferences around the world. For a free trial to the full version of
The Wagner Daily or to learn about Deron’s other services, visit
morpheustrading.com or send an e-mail
to
deron@morpheustrading.com .
